• Laser & Optoelectronics Progress
  • Vol. 59, Issue 22, 2210012 (2022)
Jiawei Zhu1, Zhaohui Jiang1、*, Shilan Hong1, Huimin Ma1, Jianpeng Xu2, and Maosheng Jin3
Author Affiliations
  • 1School of Information and Computer Science, Anhui Agricultural University, Hefei 230036, Anhui, China
  • 2Anhui Province Rural Comprehensive Economic Information Center, Hefei 230036, Anhui, China
  • 3Agricultural Information Service Center of Quanjiao County Agricultural Committee, Chuzhou 239500, Anhui, China
  • show less
    DOI: 10.3788/LOP202259.2210012 Cite this Article Set citation alerts
    Jiawei Zhu, Zhaohui Jiang, Shilan Hong, Huimin Ma, Jianpeng Xu, Maosheng Jin. Panicle Segmentation and Characteristics Analysis of Rice During Filling Stage Based on Neural Architecture Search[J]. Laser & Optoelectronics Progress, 2022, 59(22): 2210012 Copy Citation Text show less
    Panicle segmentation dataset
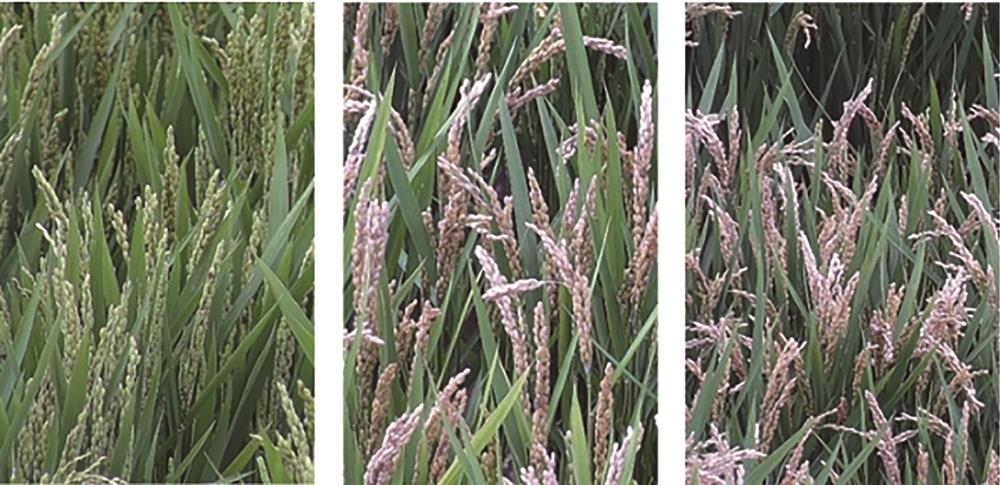
    Fig. 1. Panicle segmentation dataset
    Overall flow of algorithm
    Fig. 2. Overall flow of algorithm
    Schematic of different convolutions. (a) Normal convolution; (b) dilated convolution
    Fig. 3. Schematic of different convolutions. (a) Normal convolution; (b) dilated convolution
    Structure of DeepLabV3Plus network[13]
    Fig. 4. Structure of DeepLabV3Plus network[13]
    Schematic of DARTS[16]
    Fig. 5. Schematic of DARTS[16]
    Modified ASPP
    Fig. 6. Modified ASPP
    Curvature calculation
    Fig. 7. Curvature calculation
    Segmentation results of three network models
    Fig. 8. Segmentation results of three network models
    H channel first moment-second moment scatter diagram
    Fig. 9. H channel first moment-second moment scatter diagram
    Contrast diagram of color feature of typical samples
    Fig. 10. Contrast diagram of color feature of typical samples
    Area ratio - dispersion scatter diagram
    Fig. 11. Area ratio - dispersion scatter diagram
    Contrast diagram of sparse and dense panicle of typical samples
    Fig. 12. Contrast diagram of sparse and dense panicle of typical samples
    H channel first moment-mean curvature scatter diagram
    Fig. 13. H channel first moment-mean curvature scatter diagram
    Contrast diagram of bending of panicle of typical samples
    Fig. 14. Contrast diagram of bending of panicle of typical samples
    TrainTestSummary
    39398491
    Table 1. Distribution of panicle segmentation image dataset
    No.OperationNo.Operation
    13×3 depthwise-separable Conv53×3 average pooling
    25×5 depthwise-separable Conv63×3 max pooling
    33×3 atrous Conv with dilation rate 27skip connection
    45×5 atrous Conv with dilation rate 28no connection(zero)
    Table 2. Operating collection of search space
    MethodmIoU /%Acc /%Params size /MB
    DeepLabV3plus79.2489.64151.66
    NAS-DeepLab82.2091.3550.16
    Rice-DeepLab85.7492.6161.67
    Table 3. Evaluation indexes for segmentation of three models
    Jiawei Zhu, Zhaohui Jiang, Shilan Hong, Huimin Ma, Jianpeng Xu, Maosheng Jin. Panicle Segmentation and Characteristics Analysis of Rice During Filling Stage Based on Neural Architecture Search[J]. Laser & Optoelectronics Progress, 2022, 59(22): 2210012
    Download Citation