J. Jarrett1, M. King1, R. J. Gray1, N. Neumann2, L. Döhl3, C. D. Baird3, T. Ebert2, M. Hesse2, A. Tebartz2, D. R. Rusby1、4, N. C. Woolsey3, D. Neely1、4, M. Roth2, and P. McKenna1、†,*
Abstract
The spatial-intensity profile of light reflected during the interaction of an intense laser pulse with a microstructured target is investigated experimentally and the potential to apply this as a diagnostic of the interaction physics is explored numerically. Diffraction and speckle patterns are measured in the specularly reflected light in the cases of targets with regular groove and needle-like structures, respectively, highlighting the potential to use this as a diagnostic of the evolving plasma surface. It is shown, via ray-tracing and numerical modelling, that for a laser focal spot diameter smaller than the periodicity of the target structure, the reflected light patterns can potentially be used to diagnose the degree of plasma expansion, and by extension the local plasma temperature, at the focus of the intense laser light. The reflected patterns could also be used to diagnose the size of the laser focal spot during a high-intensity interaction when using a regular structure with known spacing.
1 Introduction
The interaction of high-intensity laser pulses with solid targets results in the production of compact high energy ion sources[1–3], as well as X-ray[4], THz[5], EMP[6, 7] and high harmonic generation[8, 9]. These novel sources are being applied for probing transient laser–plasma interaction physics on picosecond timescales[10], micron-scale resolution radiographic density diagnosis[11] and the isochoric heating of matter[12]. In addition, a wide range of potential societal applications, including medical oncology[13] and fast-ignition inertial confinement fusion[14, 15], have been proposed, all of which motivate investigation of the fundamental physics of intense laser–solid interactions.
The temperature of beams of electrons, ions or photons generated in intense laser–solid interactions is typically diagnosed by spectral measurements using spectrometers[16], stacked dosimetry film[17] or nuclear activation[18]. Diagnosing the temperature of the dense plasma heated by the intense laser light is more difficult and often involves measuring the ratio of intensities of discrete X-ray emission lines[19]. This approach involves a spatially averaged measurement over the region of the target defined by the collection angle of the X-ray spectrometer. It remains difficult to diagnose the temperature of the plasma specifically within the spatially localized region of the laser focus, near the critical density ($n_{c}$), and at a time limited to the laser pulse interaction time. We note here that the critical density surface is the density contour at which the plasma becomes opaque to the laser light and at which significant energy coupling to fast electrons occurs, via mechanisms such as resonance absorption[20], vacuum heating[21] and J $\times$ B heating[22]. The critical density is given by $n_{c}=\unicode[STIX]{x1D714}_{L}^{2}\unicode[STIX]{x1D6FE}m_{e}\unicode[STIX]{x1D716}_{0}/e^{2}$, where $\unicode[STIX]{x1D714}_{L}$ is the laser angular frequency, $m_{e}$ is the rest mass of the electron, $\unicode[STIX]{x1D716}_{0}$ is the permittivity of free space, $-e$ is the electron charge and $\unicode[STIX]{x1D6FE}=1/\sqrt{1-(v/c)^{2}}$, where $v$ is the quiver velocity of electrons in the laser field.
In addition to difficulties in diagnosing the properties of dense plasma within the spatially localized region of the laser focus at high intensities, there are also challenges in characterizing the on-shot laser focal spot size. This is particularly true in the case of tight focusing geometries, for which the highest laser intensities are achieved, due to divergence of the beam after focus. The focal spot is typically characterized at low powers before and after a high power laser shot. However, thermal-induced lensing or aberrations in the laser amplifying crystals, or self-focusing in preformed plasma at the front of the target can change the focal spot size on a full power laser shot. An ability to confirm the laser focal spot size at high intensity would provide additional confidence in calculated on-shot intensities. This is particularly important when physical processes which scale nonlinearly with intensity occur. For example, ultrathin foils undergoing relativistic self-induced transparency have been found to be highly sensitive to the laser intensity and focal spot distribution[23, 24].
Sign up for High Power Laser Science and Engineering TOC. Get the latest issue of High Power Laser Science and Engineering delivered right to you!Sign up now
In this article, we measure the spatial-intensity profile of light reflected during the interaction of intense laser pulses with microstructured targets (which are being investigated as a route to increase laser energy absorption[25, 26]). Patterns in both the reflected laser light at the fundamental harmonic and second harmonic light generated at the critical density surface[27] are characterized experimentally. We explore the possibility to use these patterns to diagnose the temperature of the plasma, localized spatially to the region of the focal spot and temporally to the peak of the interaction. Through the use of ray-tracing and numerical modelling, we explore how the spatial-intensity profile evolves as the microstructures change due to plasma expansion and relate that to the plasma temperature within the high-intensity region of the focused laser light. The influence of the size of the laser focus relative to the target structures on the reflected light patterns is also investigated, highlighting the potential to use this approach to diagnose the laser focus on high-intensity laser shots.
2 Experiment
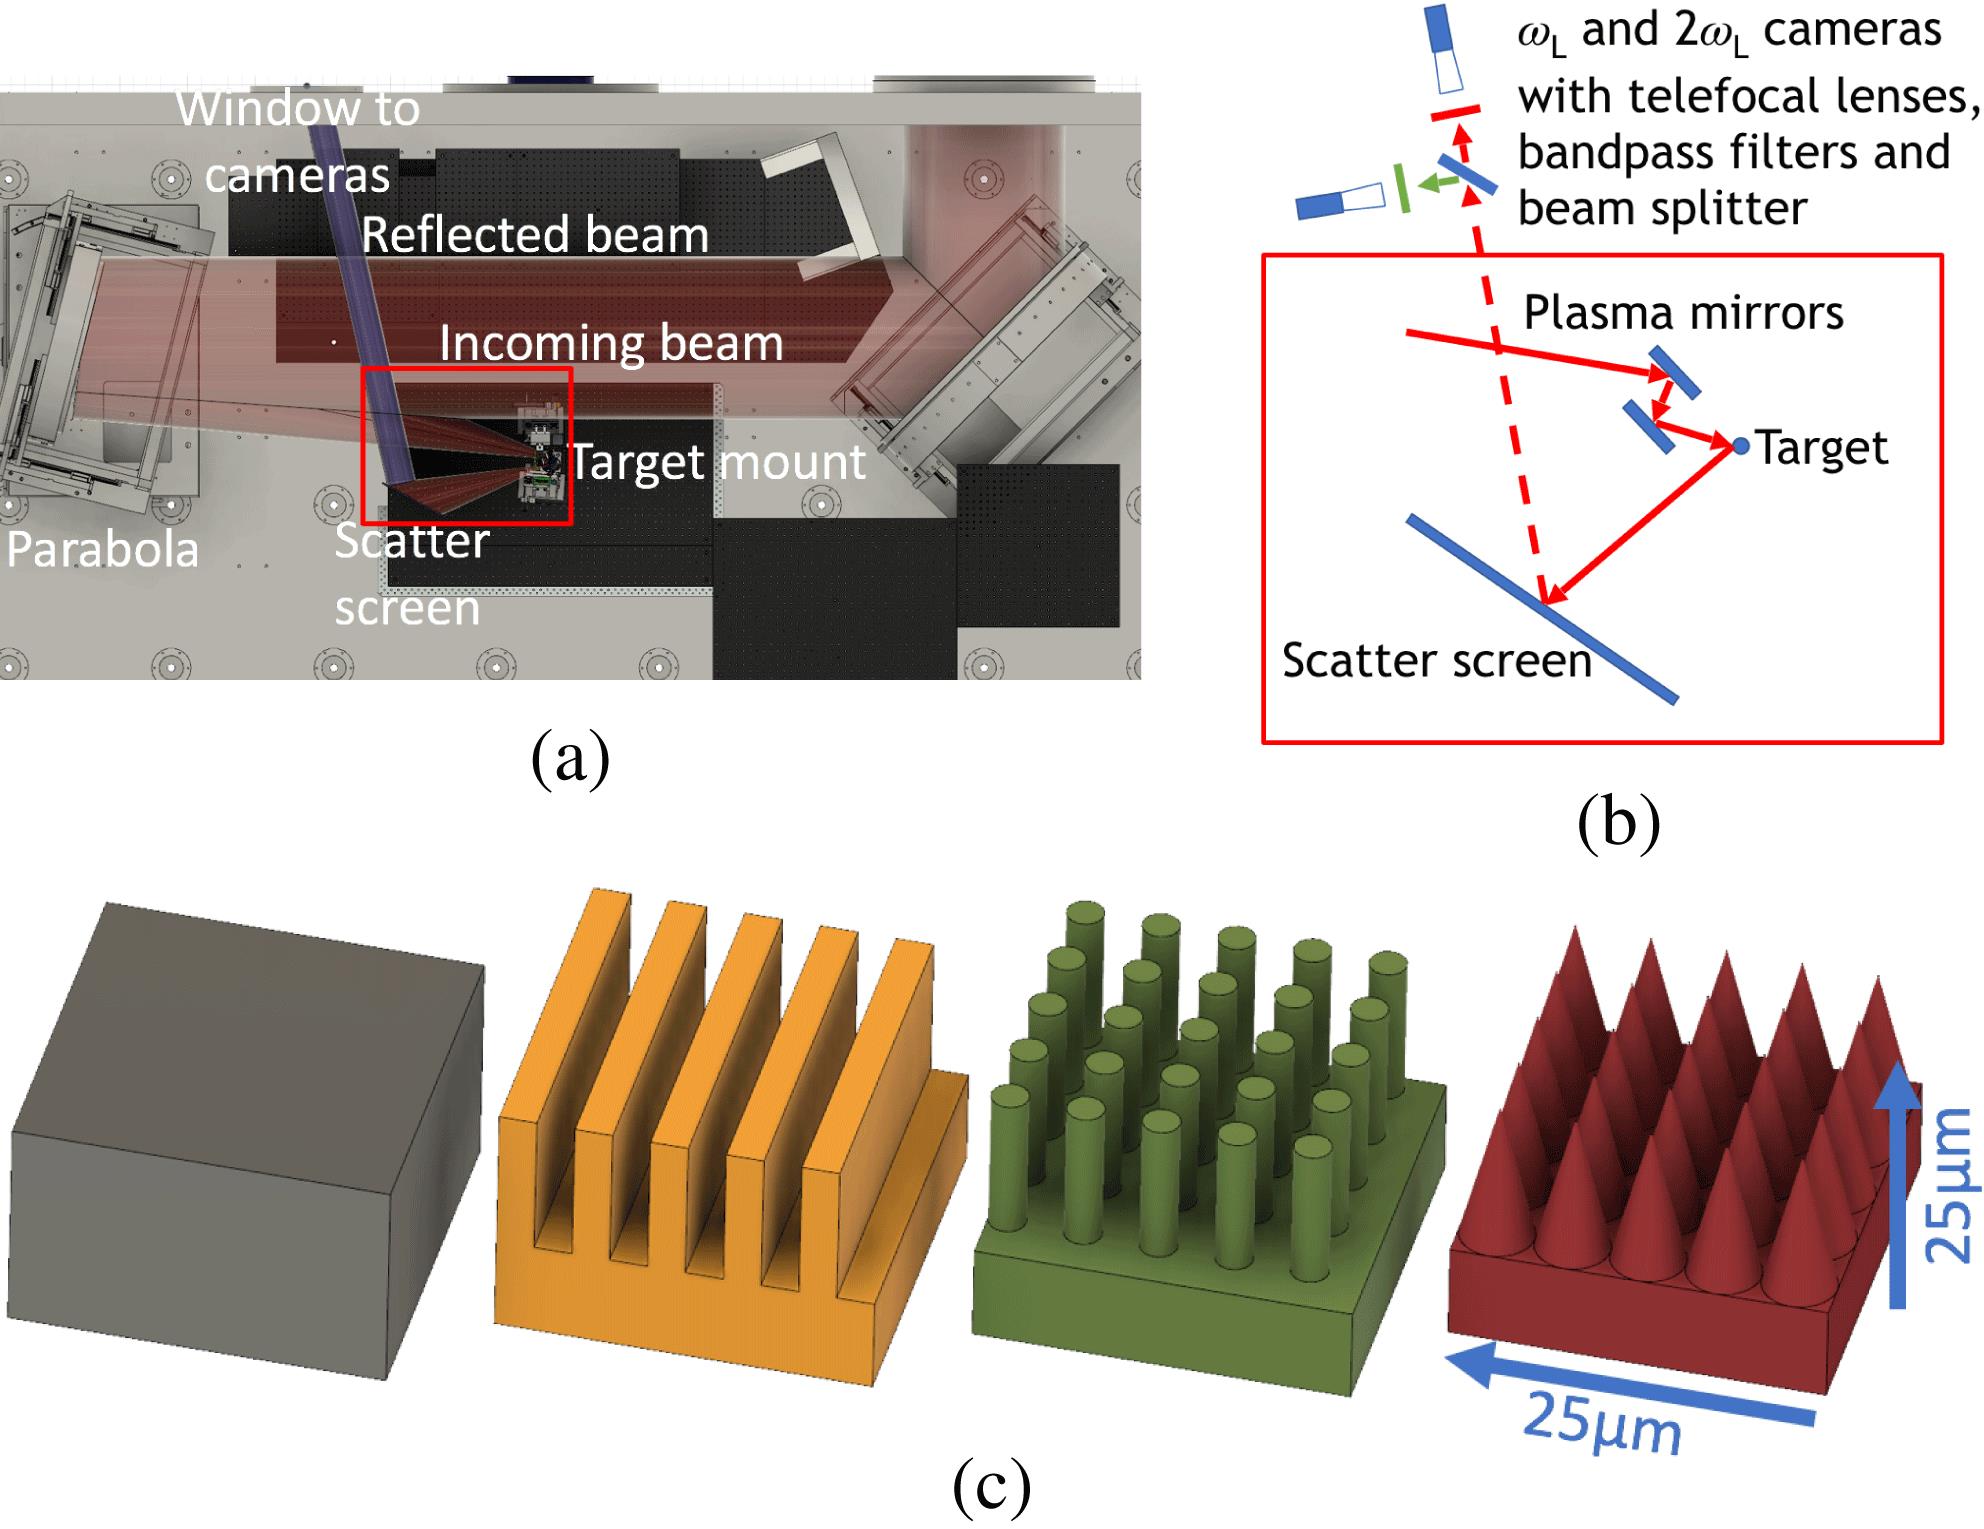
The Vulcan laser at the Rutherford Appleton Laboratory, UK, was used in this study. The light was p-polarized at a central wavelength of 1053 nm. The pulses, with duration equal to ($0.9\pm 0.1$) ps (full width at half maximum, FWHM), were focused by an $f/3$ off-axis parabolic mirror and reflected from two consecutive plasma mirrors in order to produce a very high temporal intensity contrast[28, 29]. An overview of the experimental arrangement is shown in Figures 1(a) and 1(b). This configuration resulted in laser pulses with energy $(160\pm 30)~\text{J}$ incident onto the target at an angle of $20^{\circ }$ to the target normal, focused to a spot diameter of ${\sim}7~\unicode[STIX]{x03BC}\text{m}$ FWHM (as measured at low power). The resulting laser intensity is calculated to be $(5\pm 0.5)\times 10^{19}~\text{W}\cdot \text{cm}^{-2}$.
Silicon foil targets with four distinct surface profiles, as illustrated in Figure 1(c), were used in the investigation: (1) a flat planar surface; (2) etched parallel linear grooves; (3) a uniform grid of vertical pillars; and, (4) a uniform grid of needles or cone-shaped columns. All targets were comprised of $25~\unicode[STIX]{x03BC}\text{m}$-thick silicon wafers. The structured targets consisted of a $10~\unicode[STIX]{x03BC}\text{m}$-thick base, with a $15~\unicode[STIX]{x03BC}\text{m}$-high structure. The groove structures had a width of $2~\unicode[STIX]{x03BC}\text{m}$, with $5~\unicode[STIX]{x03BC}\text{m}$ centre-to-centre spacing. The pillar structures had a diameter of $3~\unicode[STIX]{x03BC}\text{m}$, arranged in a grid layout, again with $5~\unicode[STIX]{x03BC}\text{m}$ centre-to-centre spacing, and the needle structures had a similar grid layout but with a base diameter of $5~\unicode[STIX]{x03BC}\text{m}$ and $5~\unicode[STIX]{x03BC}\text{m}$ centre-to-centre spacing (the base of each needle in contact with adjacent needles). The targets were produced at the Detector and Target Laboratory, at the Technical University of Darmstadt, using repetitive femtosecond laser pulse irradiation in a sulphur hexafluoride environment[30]. The fabrication method is described in Ref. [31].
CCD cameras mounted outside the target chamber were used to image the light reflected onto a ground-glass scatter screen, which had dimensions of $45~\text{cm}\times 45~\text{cm}$, positioned 50 cm from the target. The reflected light at the fundamental frequency ($\unicode[STIX]{x1D714}_{L}$) and second harmonic light ($2\unicode[STIX]{x1D714}_{L}$) produced at the critical density surface in the most intense region of the focal spot were both measured. This was achieved by using two CCD cameras with separate band-pass filters, with transmission centred at the two chosen wavelengths, respectively.
The patterns measured in the reflected $\unicode[STIX]{x1D714}_{L}$ and generated $2\unicode[STIX]{x1D714}_{L}$ light are shown in Figure 2. A circular disc of light is imaged at both wavelengths for the planar (unstructured) foils. In the case of the periodic groove target, the light forms a structured pattern similar to the diffraction patterns formed by light reflected from a grating structure. The spatial frequency of the structures in the $2\unicode[STIX]{x1D714}_{L}$ light is double that of the $\unicode[STIX]{x1D714}_{L}$, which is consistent with the patterns being produced by diffraction. In the case of the pillar targets, the periodic pattern is observed in two dimensions, due to the periodicity of the structure along the orthogonal axes. However, in the case of the needle targets a speckle-like pattern is imaged and arises because the light is reflected by the sides of the needles and undergoes multiple reflections.
The line-outs shown in Figure 3, for the $\unicode[STIX]{x1D714}_{L}$ and $2\unicode[STIX]{x1D714}_{L}$ light produced by the groove target, confirm the changes to the periodicity of the pattern expected from diffraction. As the second harmonic light is predominately produced at the critical surface in the intense regions of the plasma, the presence of the periodic pattern indicates that the plasma surface retains some degree of the initial target structure during the interaction with the intense laser light. These reflected light patterns may thus provide valuable insight into the evolution of the critical plasma surface in the localized region of the laser focal spot during the interactions. As such, the following sections detail numerical modelling of the laser–solid interaction to explore the critical surface evolution, along with simplified ray-tracing modelling to investigate the potential of using the specularly reflected light as a diagnostic tool.
3 Modelling
To investigate this potential, first 2D particle-in-cell (PIC) simulations were performed to investigate how the target critical density surface profile changes with time as it is irradiated by a high-intensity laser pulse. The Extendible Particle-in-cell Open Collaboration (EPOCH[32]) PIC code was used to model the interaction between a groove-structured target and a laser pulse defined as a Gaussian beam focused to a spot diameter of $7~\unicode[STIX]{x03BC}\text{m}$ (FWHM) and with a Gaussian temporal profile of 500 fs FWHM. The time $t=0$ fs is defined as the time at which the peak of the pulse reaches the target surface. The peak intensity of the laser pulse was $5\times 10^{19}~\text{W}\cdot \text{cm}^{-2}$.
The simulations were run with a $40~\unicode[STIX]{x03BC}\text{m}$$\times 28.8~\unicode[STIX]{x03BC}\text{m}$ simulation box with a mesh resolution of $2~\text{nm}\times 2~\text{nm}$, for a total simulation time equal to 1.2 ps. The plasma comprised of $\text{Si}^{12+}$ ions, with the electron and ion densities selected to ensure overall neutrality. The initial electron temperature was set at 30 keV and was varied between 30 keV and 80 keV for the case with no laser present. The initial electron density was set to $200n_{c}$. The groove target structure was initialized with the same periodicity and other dimensions as the targets used in the experiment.
Figure 4(a) shows the initialized cold target electron density from the PIC simulation at $t=-500~\text{fs}$, and Figure 4(b) shows the corresponding profile at $t=0$ (i.e. the peak of the laser pulse interaction). It is clear that as the laser pulse interacts with the target, the increase in temperature and resulting plasma expansion changes the groove structure. The gaps between the grooves fill with plasma such that the effective groove depth decreases with time.
The evolution of the plasma critical density surface due to thermal expansion was also modelled in the absence of the laser pulse. A total of $10^{8}$ particles were distributed such that they match the geometry of the groove target. The particles were defined with an initial temperature and a normal distribution of random momenta calculated using that temperature, and were then allowed to propagate ballistically with time. The model traces the outline of the critical surface as a function of time for a given starting temperature. Example plots of the critical surface at different time steps are shown in Figure 5. In order to quantify the extent of the plasma expansion at any given time, the depth of the groove structure is determined by calculating the vertical separation between the highest and lowest points (peaks and troughs) of the structure.
Next, a simplified ray-tracing model was developed to investigate how the profile of the reflected light (at a detector screen) evolves as the plasma expands and the groove depth decreases. This package, based on scripts available from the MathWorks File Exchange[33], is capable of tracing a large number of light rays as they reflect from a user-defined mirror surface. A surface closely matching that of the expanded groove profile in the PIC simulations at the peak of the interaction ($t=0$) was created. The profile is defined as $F(y)=A\sin [(\unicode[STIX]{x1D70B}/S)y+\unicode[STIX]{x1D719}]^{C}$, where $A$, $S$ and $C$ are parameters that vary the groove depth, spacing and shape, respectively, and $\unicode[STIX]{x1D719}$ is the phase of the structure. The resultant accumulation of rays reflected from the defined surface produces a series of maxima (at a distance corresponding to the experimental scatter screen distance) that varies depending upon $A$, $S$ and $C$.
Figure 6(a) shows a magnified view of the top of the grooves, illustrating how the local curvature, and thus the degree of plasma expansion, change the direction of the reflected light rays. This example is shown for $A=3.7~\unicode[STIX]{x03BC}\text{m}$, $S=5~\unicode[STIX]{x03BC}\text{m}$, $C=6$ and $\unicode[STIX]{x1D719}=\unicode[STIX]{x1D70B}$, such that the separation between the maxima (at the scatter screen distance) is similar to that measured in the experiment. This example follows the surface profile (green curve) in the simulation results in Figure 4(b). Keeping the shape parameter constant, the separation in the maxima varies with groove depth as shown in Figure 6(b).
4 Diagnosing plasma temperature and focal spot size
The numerical modelling of the thermal expansion, along with PIC simulations run without the laser pulse present for a variety of different initial temperatures, was used in order to obtain an estimate of the groove depth as a function of plasma temperature after a period of the FWHM of the laser pulse. The results of this model are plotted in Figure 7(a).
The combination of the functional dependence of the reflected light profile on the groove depth and the relationship between plasma temperature and groove depth enables the structure in the spatial-intensity distribution of the reflected light to be correlated to the plasma temperature, as shown by the model calculations in Figure 7(b) along with the corresponding PIC simulation data. The two models are in good agreement and highlight how the profile of the reflected laser light may be developed as a diagnostic of the localized plasma electron temperature.
In addition to this simple ray-tracing approach, the influence of the wave behaviour of the reflected light was also investigated by utilizing a model based on the Huygens–Fresnel principle. By assuming each point on the surface emits as a spherical wave with the intensity of each point defined by a spatial Gaussian distribution (to model an effective focal spot), it is possible to numerically integrate the resultant intensity distribution on a plane at a distance from the surface. This was set at 1 mm to ensure the plane is at a sufficient distance from the surface and yet limit the computational requirements. Figure 8(a) illustrates the behaviour of the intensity distribution for a focal spot size of $2~\unicode[STIX]{x03BC}\text{m}$ as the groove depth, $A$, is varied in the same manner as the ray-tracing model. The spacing between the maxima is observed to decrease as the groove depth is increased, tending to the separation expected from simple diffraction theory. This behaviour is similar to that of the ray-tracing model, but also shows the expected destructive interference produced as $A$ varies over one wavelength, resulting in the diffraction pattern appearing to oscillate with $A$. Experimentally, this behaviour may lead to ambiguous results, however, as $A$ evolves over the course of the interaction with the laser pulse. When the focal spot diameter is increased to $7~\unicode[STIX]{x03BC}\text{m}$, there is no change in behaviour with $A$, as shown in Figure 8(b). This indicates that in order to observe the changes in the diffraction pattern seen in the ray-tracing model, the focal spot size must be reduced to the order of the groove spacing or below.
Although this highlights a limitation in using this approach to diagnose plasma expansion and thus temperature, the dependence of the pattern on laser focal spot size, or more correctly the ratio of the focal spot diameter to the groove separation, suggests that this approach may be used to diagnose the size of the focal spot on a full power laser shot.
To explore this aspect further, Figure 9(a) shows the effect of increasing the groove spacing, $S$, on the reflected intensity profile, for a fixed focal spot FWHM of $7~\unicode[STIX]{x03BC}\text{m}$ and $A=4~\unicode[STIX]{x03BC}\text{m}$. With increasing $S$ the diffraction pattern becomes less pronounced, until it disappears for values significantly above the focal spot size. Thus the profile of the reflected light depends on the ratio of the laser focus to the groove spacing and it follows that by engineering the target to have specific values of $S$ the size of the laser focus can be determined from the measured reflected light profile.
In all of the Huygens–Fresnel analysis above, it is assumed that the pulse is centred on the middle of the groove spacing. The precise position of the focus with respect to the groove profile in an experiment is subject to the laser pointing stability. To investigate what effect this has on this diagnostic approach, we next vary the relative position of the laser focus and the target structure in our model. For convenience in the application of our model, we simply vary the phase term in the structure, keeping the centre of the laser focus fixed at $y=0$. Figure 9(b) shows the change in reflected intensity distribution as the defined structure is moved in phase, $\unicode[STIX]{x1D719}$, through $\unicode[STIX]{x1D70B}$ (as the structure is defined as a $\sin ^{2}$ function) for a focal spot of $7~\unicode[STIX]{x03BC}\text{m}$ and $S=35~\unicode[STIX]{x03BC}\text{m}$. As the spot size is much smaller than $S$, when the centre of the focal spot moves away from the middle of the groove structure, the reflection from the structure slope dominates, resulting in a displacement of the central maxima in the reflected pattern. Additional maxima are observed, skewed in one direction. As the relative displacement is increased, the slope of the structure changes direction resulting in the central maxima displacement inverting. This indicates that although there is a variation depending upon where on the structure the focal spot is centred, the variation is predictable. When $S$ is reduced to $20~\unicode[STIX]{x03BC}\text{m}$, as shown in Figure 9(c), the central maximum is displaced to a similar extent, but the diffraction effects become stronger. Finally, as shown in Figure 9(d), reducing $S$ to $5~\unicode[STIX]{x03BC}\text{m}$, a value smaller than the focal spot size, the relative position of the focal spot has no effect on the diffraction pattern, as expected.
5 Summary
This study shows that by analysing the pattern of the laser light reflected from a microstructured target it may be possible to diagnose the local plasma temperature in the intense region of the laser focus. This approach can also potentially be applied to determine the size of the laser focal spot at full power. It has been verified experimentally that the target structure remains intact long enough during the interaction with the intense laser pulse for periodic structures to be produced in the reflected light at both $\unicode[STIX]{x1D714}_{L}$ and $2\unicode[STIX]{x1D714}_{L}$. The plasma surface evolves over the interaction, but the temporal window over which the expansion is probed can be reduced by using second (or higher order) harmonic light, which is only produced above a threshold intensity. The approach is limited, however, to laser intensities below the threshold for which the laser radiation pressure exceeds the thermal plasma pressure. Above this, plasma expansion is replaced by laser hole-boring into the target, resulting in additional deformation of the critical density surface[34]. By employing multiple microstructured targets with different groove spacings, it may also be possible to determine the actual focal spot size due to the presence or absence of the expected diffraction structures in the specularly reflected light. The approach could also potentially be extended by engineering variations into the groove pattern to enable the degree of asymmetry in the spatial-intensity distribution of the laser focus to be determined.
References
[1] H. Daido, M. Nishiuchi, A. Pirozhkov. Rep. Prog. Phys., 75(2012).
[2] A. Macchi, M. Borghesi, M. Passoni. Rev. Mod. Phys., 85, 751(2013).
[3] A. Higginson, R. J. Gray, M. King, R. J. Dance, S. D. R. Williamson, N. M. H. Butler, R. Wilson, R. Capdessus, C. Armstrong, J. S. Green, S. J. Hawkes, P. Martin, W. Q. Wei, S. R. Mirfayzi, X. H. Yuan, S. Kar, M. Borghesi, R. J. Clarke, D. Neely, P. McKenna. Nature Commun., 9, 724(2018).
[4] M. M. Murnane, H. C. Kapteyn, R. W. Falcone. Phys. Rev. Lett., 62, 155(1989).
[5] M. Singh, R. P. Sharma. Contrib. Plasma Phys., 53, 540(2013).
[6] M. J. Mead, D. Neely, J. Gauoin, R. Heathcote, P. Patel. Rev. Sci. Instrum., 75, 4225(2004).
[7] P. Bradford, N. C. Woolsey, G. G. Scott, G. Liao, H. Liu, Y. Zhang, B. Zhu, C. Armstrong, S. Astbury, C. Brenner, P. Brummitt, F. Consoli, I. East, R. Gray, D. Haddock, P. Huggard, P. J. R. Jones, E. Montgomery, I. Musgrave, P. Oliveira, D. R. Rusby, C. Spindloe, B. Summers, E. Zemaityte, Z. Zhang, Y. Li, P. McKenna, D. Neely. High Power Laser Sci. Eng., 6, e21(2018).
[8] B. Dromey, M. Zepf, A. Gopal, K. Lancaster, M. S. Wei, K. Krushelnick, M. Tatarakis, N. Vakakis, S. Moustai‘is, R. Kodama, M. Tampo, C. Stoeckl, R. Clarke, H. Habara, D. Neely, S. Karsch, P. Norreys. Nature Phys., 2, 456(2006).
[9] R. A. Ganeev. J. Phys. B, 40, R213(2007).
[10] M. Borghesi, D. H. Campbell, A. Schiavi, M. G. Haines, O. Willi, A. J. MacKinnon, P. Patel, L. A. Gizzi, M. Galimberti, R. J. Clarke, F. Pegoraro, H. Ruhl, S. Bulanov. Phys. Plasmas, 9, 2214(2002).
[11] A. J. MacKinnon, P. K. Patel, M. Borghesi, R. C. Clarke, R. R. Freeman, H. Habara, S. P. Hatchett, D. Hey, D. G. Hicks, S. Kar, M. H. Key, J. A. King, K. Lancaster, D. Neely, A. Nikkro, P. A. Norreys, M. M. Notley, T. W. Phillips, L. Romagnani, R. A. Snavely, R. B. Stephens, R. P. J. Town. Phys. Rev. Lett., 97(2006).
[12] P. K. Patel, A. J. MacKinnon, M. H. Key, T. E. Cowan, M. E. Foord, M. Allen, D. F. Price, H. Ruhl, P. T. Springer, R. Stephens. Phys. Rev. Lett., 91(2003).
[13] S. Bulanov, V. S. Khoroshkov. Plasma Phys. Rep., 28, 453(2002).
[14] M. Tabak, J. Hammer, M. E. Glinsky, W. L. Kruer, S. C. Wilks, J. Woodworth, E. M. Campbell, M. D. Perry. Phys. Plasmas, 1, 1626(1994).
[15] M. Roth, T. E. Cowan, M. H. Key, S. P. Hatchett, C. Brown, W. Fountain, J. Johnson, D. M. Pennington, R. A. Snavely, S. C. Wilks, K. Yasuike, H. Ruhl, F. Pegoraro, S. V. Bulanov, E. M. Campbell, M. D. Perry, H. Powell. Phys. Rev. Lett., 86, 436(2001).
[16] D. C. Carroll, P. Brummitt, D. Neely, F. Lindau, O. Lundh, C. G. Wahlström, P. McKenna. Nucl. Instrum. Methods Phys. A, 620, 23(2010).
[17] D. Rusby, L. A. Wilson, R. J. Gray, R. J. Dance, N. M. H. Butler, D. A. MacLellan, G. G. Scott, V. Bagnoud, B. Zielbauer, P. McKenna, D. Neely. J. Plasma Phys, 81(2015).
[18] M. Zepf, E. L. Clark, K. Krushelnick, F. N. Beg, C. Escoda, A. E. Dangor, M. I. K. Santala, M. Tatarakis, I. F. Watts, P. A. Norreys, R. J. Clarke, J. R. Davies, M. A. Sinclair, R. D. Edwards, T. J. Goldsack, I. Spencer, K. W. D. Ledingham. Appl. Phys. Lett., 8, 2323(2001).
[19] Y. Zhao, B. Deng, G. Xiong, Z. M. Hu, M. X. Wei, T. Zhu, W. L. Shang, J. Li, G. H. Yang, J. Y. Zhang, J. M. Yang. Phys. Lett., 28(2011).
[20] J. P. Freidberg, R. W. Mitchell, R. L. Morse, L. I. Rudsinski. Phys. Rev. Lett., 28, 795(1972).
[21] F. Brunel. Phys. Rev. Lett., 59, 52(1987).
[22] L. Kruer, K. Estabrook. Phys. Fluids., 28, 430(1985).
[23] B. Gonzalez-Izquierdo, R. J. Gray, M. King, R. J. Dance, R. Wilson, J. McCreadie, N. M. H. Butler, R. Capdessus, S. Hawkes, J. S. Green, M. Borghesi, D. Neely, P. McKenna. Nature Phys., 12, 505(2016).
[24] B. Gonzalez-Izquierdo, M. King, R. J. Gray, R. Wilson, R. J. Dance, H. Powell, D. A. MacLellan, J. McCreadie, N. M. H. Butler, S. Hawkes, J. S. Green, C. D. Murphy, L. C. Stockhausen, D. C. Carroll, N. Booth, G. G. Scott, M. Borghesi, D. Neely, P. McKenna. Nature Commun., 7(2016).
[25] S. Jiang, A. G. Krygier, D. W. Schumacher, K. U. Akli, R. R. Freeman. Phys. Rev. E., 89(2014).
[26] D. Margarone, O. Klimo, I. J. Kim, J. Prokupek, J. Limpouch, T. M. Jeong, T. Mocek, J. Psikal, H. T. Kim, J. Proska, K. H. Nam, L. Stolcova, I. W. Choi, S. K. Lee, J. H. Sung, T. J. Yu, G. Korn. Phys. Rev. Lett., 109(2012).
[27] M. J. V. Streeter, P. S. Foster, F. H. Cameron, M. Borghesi, C. Brenner, D. C. Carroll, E. Divall, N. P. Dover, B. Dromey, P. Gallegos, J. S. Green, S. Hawkes, C. J. Hooker, S. Kar, P. McKenna, S. R. Nagel, Z. Najmudin, C. A. J. Palmer, R. Prasad, K. E. Quinn, P. P. Rajeev, A. P. L. Robinson, L. Romagnani, J. Schreiber, C. Spindloe, S. Ter-Avetisyan, O. Tresca, M. Zepf, D. Neely. New J. Physics., 13(2011).
[28] B. Dromey, S. Kar, M. Zepf, P. Foster. Rev. Sci. Instrum., 75, 645(2004).
[29] G. G. Scott, V. Bagnoud, C. Brabetz, R. J. Clarke, J. S. Green, R. I. Heathcote, H. W. Powell, B. Zielbauer, T. D. Arber, P. McKenna, D Neely. New J. Phys., 17(2015).
[30] T.-H. Her, R. J. Finlay, C. Wu, S. Deliwala, E. Mazur. Appl. Phys. Lett., 73, 1673(1998).
[31] T. Ebert, N. W. Neumann, T. Abel, G. Schaumann, M. Roth. High Power Laser Sci. Eng., 13, e18(2017).
[32] T. D. Arber, K. Bennett, C. S. Brady, A. Lawrence-Douglas, M. G. Ramsay, N. J. Sircombe, P. Gillies, R. G. Evans, H. Schmitz, A. R. Bell, C. P. Ridgers. Plasma Phys. Control. Fusion, 57(2015).
[33]
[34] B. Gonzalez-Izquierdo, R. Capdessus, M. King, R. J. Gray, R. Wilson, R. J. Dance, J. McCreadie, N. M. H. Butler, St. J. Hawkes, J. S. Green, N. Booth, M. Borghesi, D. Neely, P. McKenna. Appl. Sci., 8, 336(2018).