Author Affiliations
1School of Investigation, People's Public Security University of China, Beijing 100038, China2Institute of Criminal Science and Technology, Zhengzhou Public Security Bureau, Zhengzhou, Henan 450000, Chinashow less
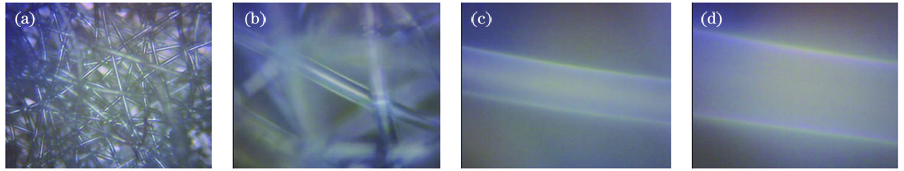
Fig. 1. Appearances of masks under different magnifications. (a) 5×; (b) 20×; (c) 50×; (d) 100×
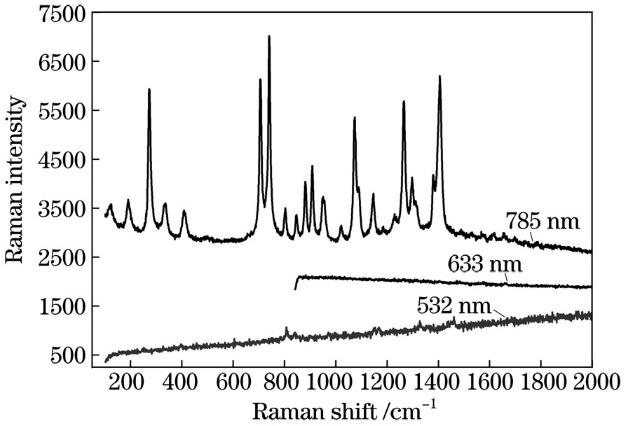
Fig. 2. Mask spectra obtained by different wavelength lasers
Fig. 3. Experimental results of reproducibility and uniformity of mask samples. (a) Reproducibility experiment; (b) uniformity experiment
Fig. 4. Raman spectrum processing results of 37 mask samples
Fig. 5. Flow chart of the mask classification model based on Raman spectroscopy
Fig. 6. Visualization of the PCA
Fig. 7. Characteristic peaks of the Raman spectrum of the mask. (a) 8#, 10#, 14# , 16#; (b) 1#, 2#, 19#, 31#, 33#; (c) 3#, 12#, 13#, 35#; (d) 21#, 25#, 29#, 30#
Fig. 8. Prediction results of the SVM model. (a) Train set; (b) test set
Fig. 9. Prediction results of the Bayesian discriminant analysis model. (a) Train set; (b) test set
Fig. 10. Relationship between iteration times and cross entropy
Label | Brand | Manufacturer |
---|
1 | Xuancheng mask | Rizhao Nuohuan Protective Equipment Co., Ltd | 2 | Huian mask | Zhangjiagang Meibaiqi Trade Co., Ltd | 3 | ShengWang mask | Xiantao Siqi Protective Equipment Co., Ltd | 4 | JiaBoNeng mask | Guangdong Dongwan Yian labor protection products Co., Ltd | … | … | … | 33 | Huian mask | Suzhou Lotte Protective Equipment Co., Ltd | 34 | ZHICHANG mask | Nanchang of Jiangxi Province | 35 | Sanbang mask | Foshan Nanhai Weijian Sanbang Protective Equipment Technology Co., Ltd | 36 | Taibang mask | Yunnan Baiyao Group Co., Ltd | 37 | 3M mask | 3M China Ltd |
|
Table 1. Sample parameters of the disposable protective masks
PC | Eigenvalue | Variance /% | Cumulative variance /% |
---|
1 | 18.80335 | 49.02 | 49.02 | 2 | 13.85901 | 36.13 | 85.15 | 3 | 2.36197 | 6.16 | 91.31 | 4 | 1.76937 | 4.61 | 95.92 | 5 | 1.06630 | 2.78 | 98.70 | 6 | 0.13423 | 0.35 | 99.05 | 7 | 0.09534 | 0.25 | 99.30 | 8 | 0.06265 | 0.16 | 99.46 | 9 | 0.03321 | 0.09 | 99.55 | 10 | 0.02942 | 0.08 | 99.63 | 11 | 0.02400 | 0.06 | 99.69 | 12 | 0.02108 | 0.05 | 99.74 | 13 | 0.01752 | 0.05 | 99.79 | 14 | 0.01311 | 0.03 | 99.82 | 15 | 0.01148 | 0.03 | 99.85 | 16 | 0.01001 | 0.03 | 99.88 | 17 | 0.00800 | 0.02 | 99.90 | 18 | 0.00729 | 0.02 | 99.92 | 19 | 0.00525 | 0.01 | 99.93 | 20 | 0.00471 | 0.01 | 99.95 | 21 | 0.00387 | 0.01 | 99.96 | 22 | 0.00341 | 0.01 | 99.97 | 23 | 0.00250 | 0.01 | 99.97 | 24 | 0.00202 | 0.01 | 99.98 | 25 | 0.00168 | 0.00 | 99.98 | 26 | 0.00142 | 0.00 | 99.99 | 27 | 0.00116 | 0.00 | 99.99 | 28 | 0.00090 | 0.00 | 99.99 | 29 | 0.00084 | 0.00 | 99.99 | 30 | 0.00063 | 0.00 | 99.99 | 31 | 0.00060 | 0.00 | 100.00 |
|
Table 2. Contribution rate of the PCA characteristic variance
Class | Sample number |
---|
1 | 1#、2#、19# | 2 | 31# | 3 | 33# | 4 | 14# | 5 | 4#、7#、8#、9#、10#、11#、16#、17#、18#、20#、22#、23#、26#、27#、29#、34#、37# | 6 | 3#、5#、6#、12#、13#、15#、21#、24#、25#、28#、30#、32#、35#、36# |
|
Table 3. Mask classification results based on PCA and Raman spectra
Kernel function type | Training set accuracy /% | Test set accuracy /% | Run time /s |
---|
Linear | 50.0 | 28.6 | 5 | Polynomial | 46.5 | 42.9 | 10 | RBF | 93.3 | 100.0 | 20 | Sigmoid | 96.7 | 85.0 | 15 |
|
Table 4. Influence of different kernel functions on the SVM model
Function | Eigenvalue | Variance /% | Cumulative variance /% | Canonical correlation | Function test | Wilks’lambda | Sig |
---|
1 | 15064.487 | 66.2 | 66.2 | 1 | 1--5 | 0.00 | 0.00 | 2 | 6222.540 | 27.4 | 93.6 | 1 | 2--5 | 0.00 | 0.00 | 3 | 1303.951 | 5.7 | 99.3 | 1 | 3--5 | 0.00 | 0.00 | 4 | 126.670 | 0.6 | 99.9 | 0.996 | 4--5 | 0.00 | 0.00 | 5 | 24.217 | 0.1 | 100 | 0.980 | 5 | 0.04 | 0.00 |
|
Table 5. Bayesian discriminant function of mask samples