1State Key Laboratory of Advanced Optical Communication Systems and Networks, Department of Physics and Astronomy, Shanghai Jiao Tong University, Shanghai 200240, China
2Shanghai Key Laboratory of Crime Science Evidence, Shanghai Research Institute of Criminal Science and Technology, Shanghai 200083, China
A hollow-core metal-cladding waveguide (HCMW) optofluidic resonator that works based on a free-space coupling technique is designed. An HCMW can excite ultra-high-order modes (UOMs) at the coupled angle, which can be used as an optofluidic resonator to detect alterations of the epidermal growth factor receptor (EGFR) concentration. Theoretical analysis shows that the UOMs excited in the HCMW have a highly sensitive response to the refractive index (RI) variation of the guiding layer. An EGFR solution with a 0.2 ng/mL alteration is detected, and the RI variation caused by the concentration alteration is about .
In 1960, Cohen isolated an active substance that can stimulate the activity of nerve growth in a rat submandibular gland[1]. He purified the single polypeptide composed of 53 amino acids and called it an epidermal growth factor (EGF)[2]. Research shows that most tumor occurrences have a close relationship with the EGF. (1) Some tumor cells can produce an autocrine EGF signal, which could act directly on the receptors of the cell membrane and accelerate its abnormal proliferation without inhibition[3–5]. (2) The arrangement and composition of the EGF receptor (EGFR) amino acids have high homology with some cancer gene production. (3) A variety of tumor cells excessively express EGFR, such as squamous carcinoma, and papilloma of the larynx[6–9]. Therefore, monitoring the EGFR concentration of the internal environment or blood system is a key factor in the treatment of cancer. However, the discovery and definition of early cancer is difficult to realize.
Many approaches have been adopted for detection methods. The qualitative and semi-quantitative immunohistochemical method (IHCM)[10–12] and quantitative enzyme-linked immunosorbent assay (ELISA)[13,14] are two of the most important and common methods for EGFR detection. Besides the biochemistry means, optical technology also has been used for biology gauging[15,16]. Some researchers have made use of the surface plasmon resonance for EGFR detection and mensuration[17]. The peculiar properties, such as high sensitivity, fast response, and mechanical stability, allow optical technology to become a powerful tool for biology research.
In this Letter, a hollow-core metal-cladding waveguide (HCMW) that works based on an optical resonant mode possessing a high mechanical stability is proposed. In the HCMW, high-density cavity modes in the guiding layer can be obtained, and these cavity modes have fast responses, small dimensions, and high sensitivity. Different from other optical biosensors, such as surface plasmon resonance[18–21], long-range surface plasmon resonance[22], resonant mirror[23], leaky mode waveguides[24], and reverse symmetrical waveguide[25] in which the analyte to be detected is located in the region where the evanescent wave of the resonant modes propagates, the HCMW allows the analyte to be contained in the region where the oscillating wave is located, and most of the mode power is concentrated.
Sign up for Chinese Optics Letters TOC. Get the latest issue of Chinese Optics Letters delivered right to you!Sign up now
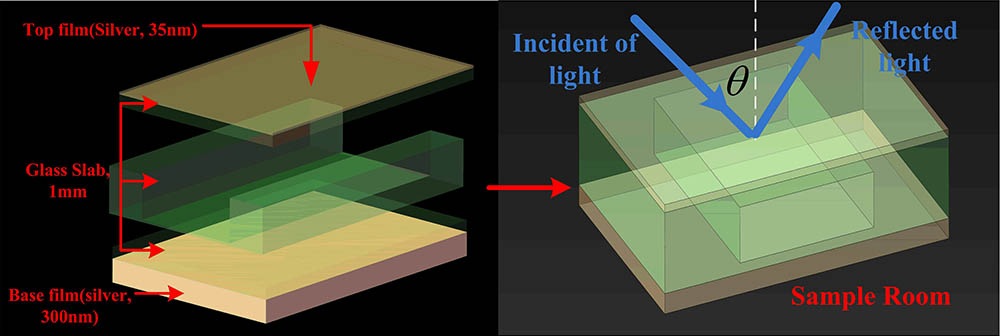
The structure of the HCMW is shown in Fig. 1, whose coupling layer is a 35 nm thick silver film deposited on a thin glass slab 0.3 mm thick. Another 300 nm thick silver film serves as the substrate to prevent light leakage. The guiding layer is 1.1 mm thick and consists of two glass slabs and a sample room that is 0.5 mm thick. Note that the volume of the cavity is approximately 0.02 ml.
Figure 1.Schematic diagram of the HCMW, where the glass and the analyte serve as the guiding layer.
Figure 2(a) plots a calculated reflectivity of the ultra-high-order modes (UOMs) that can be excited by the free spacing coupling technology[26] because the effective refractive index (RI) of the HCMW chip is less than the unit[27]. When the phase matching condition is fulfilled, energy is transferred from the reflected light and coupled into the guided UOMs. Thus, a reflection dip is formed at the resonance angle, and the optical intensity in the guiding layer is significantly enhanced compared to the incident light. During the angle scanning, a series of resonance dips with respect to the excitation of the guided modes then produce an attenuated total reflection (ATR) spectrum[26], as shown in the subplot of Fig. 2(a). Another important feature of the UOMs is that their mode density is high, such that the difference between the propagation constant of two adjacent modes is relatively small. From top to bottom, the dielectric coefficient and thickness of the analyte, glass slab, and thin silver film are denoted as and , respectively. The dispersion equation is approximated by Ref. [28], where is the propagation constant, is the wave vector in vacuum, and is the wavelength of the incident light. The effective RI of the guided mode is defined as[28]and the propagation constant can be easily determined by the measurement of the synchronous angle . After the determination of the propagation constants of three adjacent guided modes , two feature parameters of the analyte and can be determined by solving the transcendental equations,
Figure 2.(Color online) (a) Calculated reflectivity spectrum of the UOMs with respect to the incident angle. (b) Resonant angle shift caused by the change of the analyte RI.
In the above equations, the thickness of the coupling layer is assumed to be semi-infinite, however, the actual thickness is a finite value; therefore, the analyte thickness () and RI () can be calculated by Eq. (5).
As seen in Fig. 2(b), a minute variation of will consequently cause an angular shift of the resonance dip.
An EGFR solution with different concentrations was achieved by calculating the ratio of the EGFR and deionized water (produced by an ultra-pure water system: Milli-Q Direct-Q8, EMD Millipore Corporation, Billerica, MA, USA).
The schematic diagram of the experimental setup is shown in Fig. 3. To excite the UOMs of the HCMW, a TE polarized laser beam from a solid-state laser (473 nm, 25 mW diode-pumped solid-state laser, Shanghai Optical Engine, Inc., Shanghai, China) was induced to impinge upon the thin silver film of the HCMW that was located on a computer controlled goniometer. The rotation of the goniometer was controlled by a the two-phase stepping motor driver, and the subdivided angle for one step can reach to , which is enough accuracy to adjust the incident angle. In order to avoid the impact of temperature fluctuations, the room temperature was held constant at 23.5°C, and two apertures with diameters of 1 mm were inserted to confine the divergence of the incident light. The sample solution was pumped into and out of the cell room by a syringe through inlet and outlet pipes with a 0.5 mm inner diameter. The position resonance dip was highly sensitive to the RI change of the analyte.
Figure 4(a) shows the ATR spectra including an EGFR solution with different concentrations and water. The concentrations selected in this experiment were 0 (phosphate-buffered saline, PBS), 0.1, 0.3, 0.5, 0.7, and 0.9 ng/mL. Five resonance dips were shown for each of the different concentration solutions, which was sufficient for us to calculate the RI. Figure 4(b) shows the resonance angles shift with the concentration variation. We selected the minimum resonance angle of each solution from the ATR spectra shown in Fig. 4(a), each of which relates to the same . As the EGFR concentration increases, the resonance angle varies from 2.68 to 2.870.
Figure 4.(Color online) (a) ATR spectra of each solution in the experiment. (b) The resonance dips shift for each solution referring to the same .
Tiny variations in the analyte solution concentrations can be detected through the obvious resonance dip shifts. As shown in Fig. 4(a), the same guiding mode has a fixed location range of the angle of incidence, and in the same fixed location range where all of the concentrations corresponding to the mode curve are separated by the same order. Both the experimental and theoretical angle shift of the ATR peak, referring to the same order guiding mode, is given in Fig. 5. As we can see, the angle shift of the ATR peak has a nearly linear relationship with the concentration of the solution. By detecting the angle shift , we can achieve a quantitative analysis of the solution concentration.
Figure 5.Compared experimental and theoretical angle shifts. The blue and red lines are the experimental and theoretical angle shifts, respectively.
Three continuous resonance angles have been selected to calculate the RI of each solution based on Eq. (5). According the angle shift of ATR peaks shown in Fig. 5, the RI variation caused by the 0.2 ng/mL alteration of EGFR solution is about .
The sensitivity of the resonator is closely related to the ratio of light energy interacting with the analyte, the bigger ratio, and the higher sensitivity[29]. Because the HCMW works based on the oscillating field, the ratio of energy is more preferable than the evanescent field[16–21] and can lead to strong confinement of the light power in the guiding region. Meanwhile, the effective RI of the UOMs is small, nearing zero. Both of the above-mentioned lead to a sufficient interaction between the light and analyte solution.
Because of the high sensitivity, the temperature variation becomes the major noise source. Thus, constant temperature control is highly important. In Fig. 4(b), we also find that the dip depths change with the EGFR solution concentration variation. This phenomenon has already been studied with an inorganic substance[30]. As the HCMW has a simple structure and high sensitivity, it can also be used to detect many other materials.
In this Letter, an optofluidic resonator that works based on UOMs to detect low-concentration EGFR with high sensitivity is proposed. Theoretical analysis show the resonator corresponds to a high resolution of low-concentration RI variations. Moreover, we can directly determine the concentration of the solution by the ATR peak shifts. In the experiment, an EGFR solution with different low concentrations (ng/mL) is detected, and the RI variation caused by the alteration of the EGFR solution is given.