
Zhihuan Wu, Yongming Gao, Lei Li, Junshi Xue. Fully Convolutional Network Method of Semantic Segmentation of Class Imbalance Remote Sensing Images[J]. Acta Optica Sinica, 2019, 39(4): 0428004
- Acta Optica Sinica
- Vol. 39, Issue 4, 0428004 (2019)
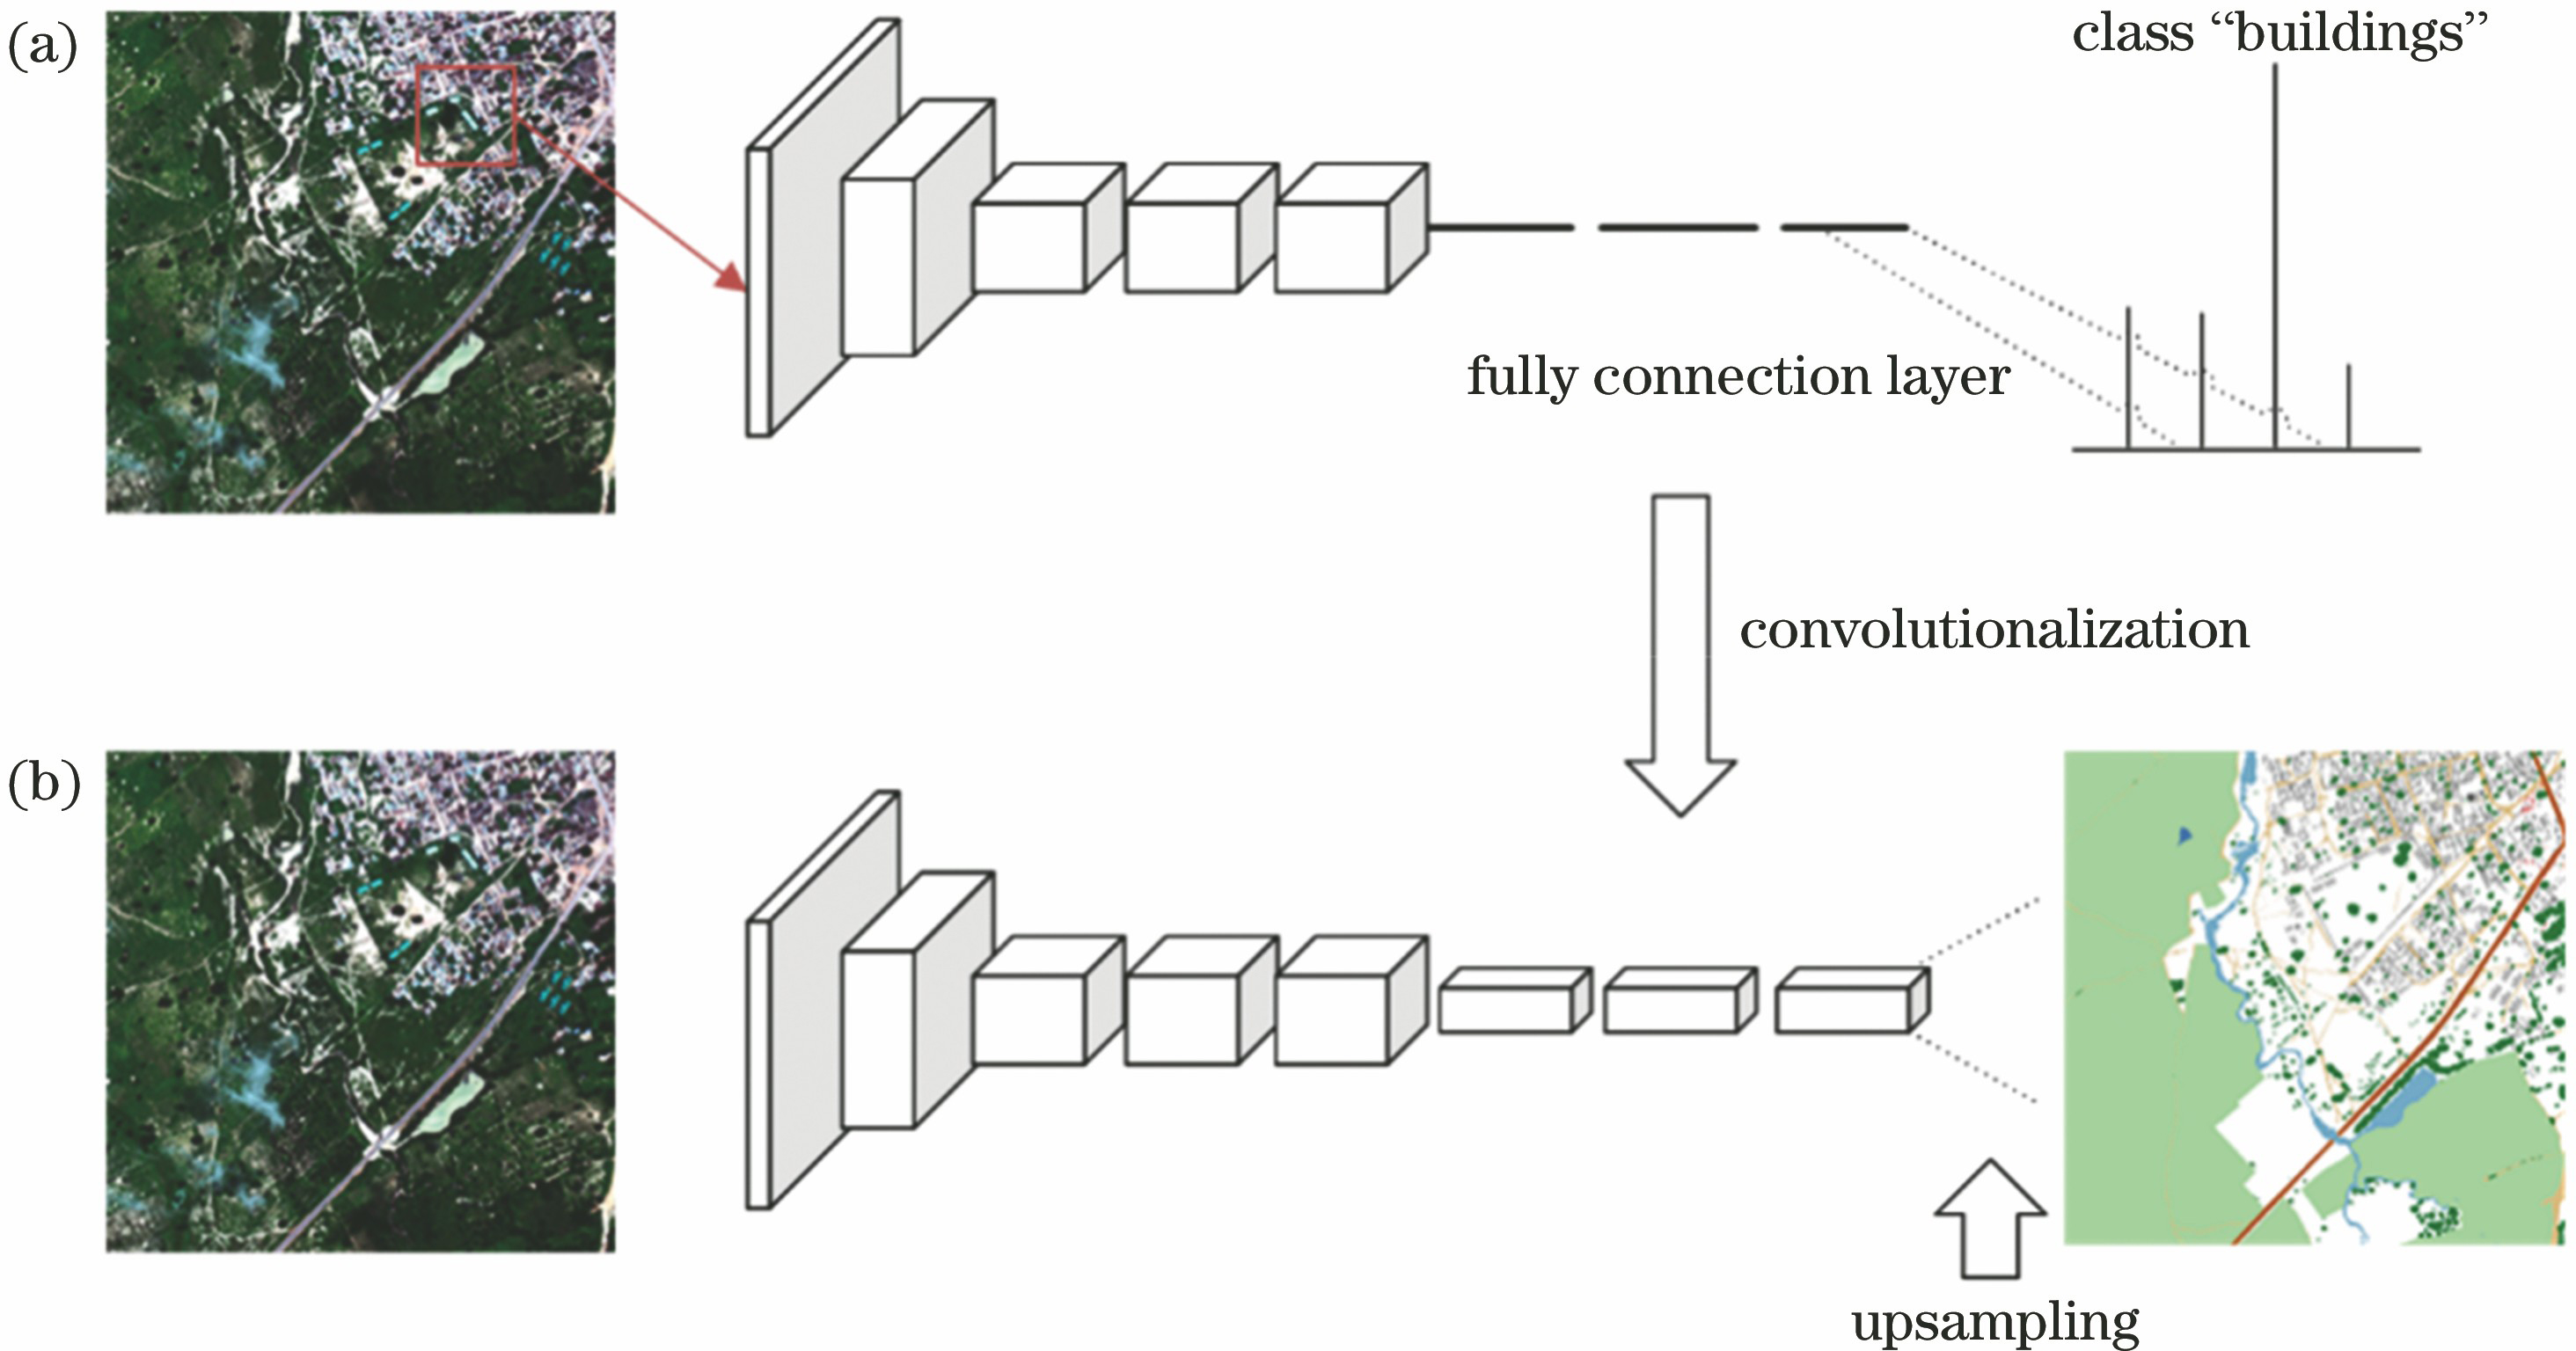
Fig. 1. Comparison of FCN and CNN based on image blocks. (a) CNN; (b) FCN
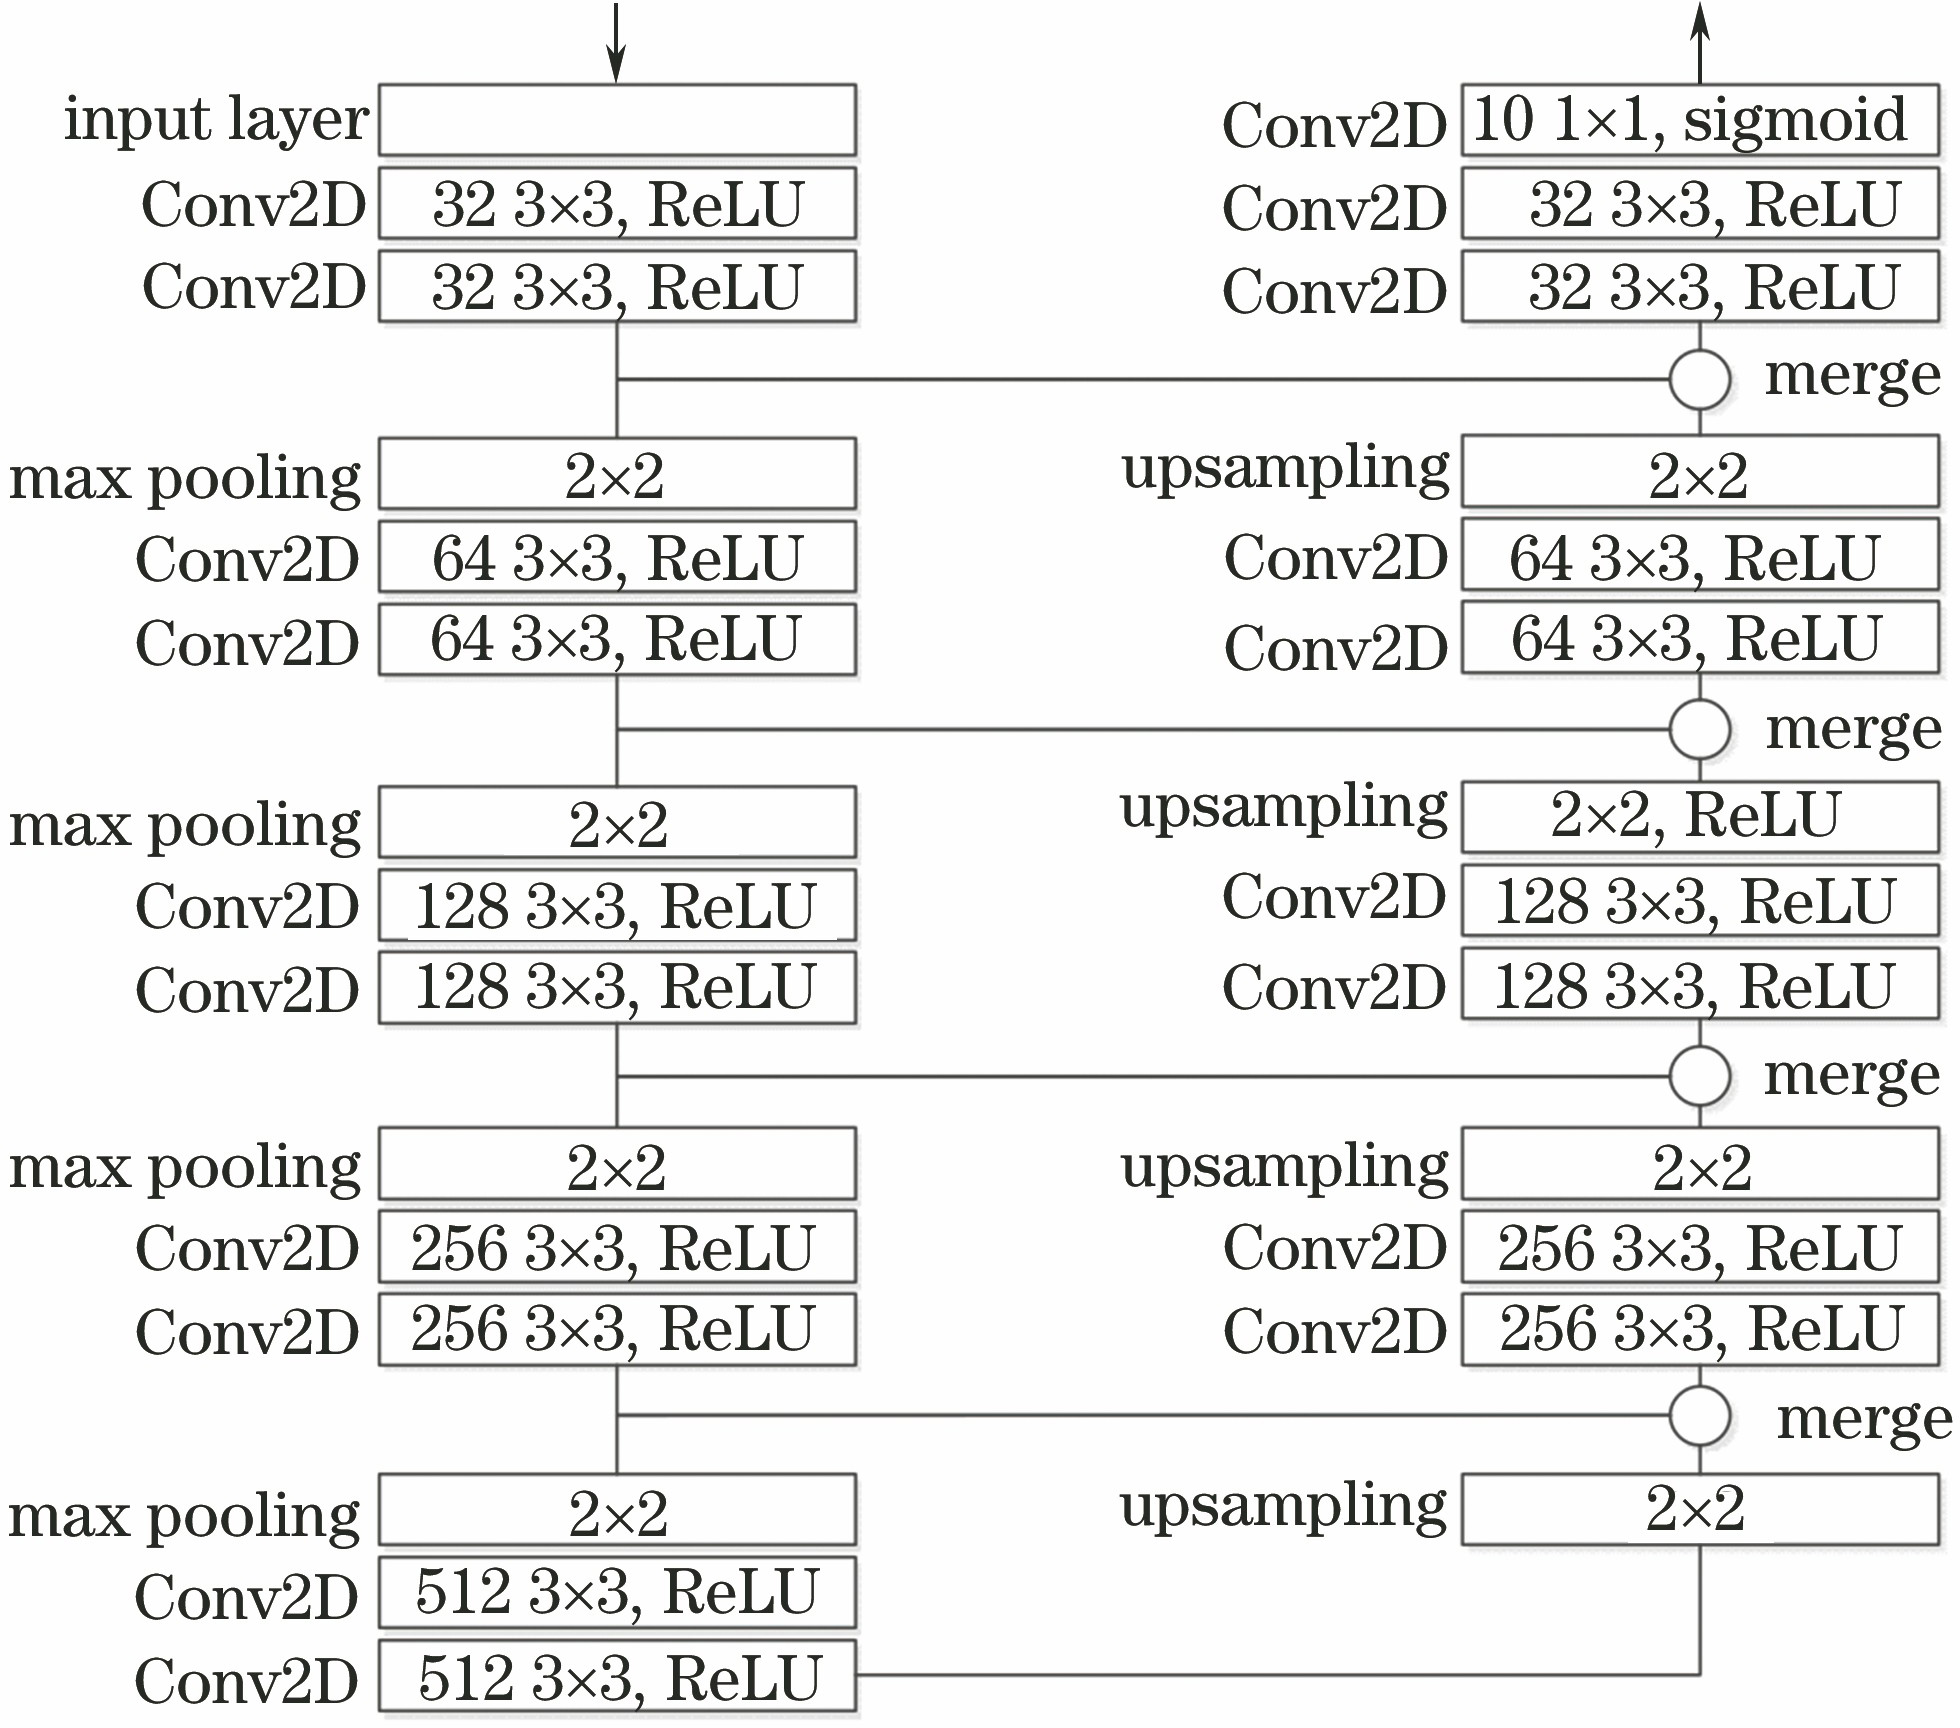
Fig. 2. Architecture of model system
Fig. 3. Class distribution of DSTL dataset
Fig. 4. Labels of image in DSTL dataset
Fig. 5. Training process. (a) Accuracy; (b) loss function; (c) Jaccard_coef; (d) Jaccard_coef_int
Fig. 6. Results predicted by model
Fig. 7. Relationship between evaluation value and threshold of each class
Fig. 8. Experimental results by proposed method. (a)-(c) Ground truths; (d)-(f) results with adaptive threshold; (g)-(i) results without adaptive threshold
Fig. 9. Experimental results by proposed method. (a)-(c) Results of Patch-based CNN model; (d)-(f) results with adaptive threshold and without data augmentation; (g)-(i) results without adaptive threshold and without data augmentation
Fig. 10. Experimental results of small class. (a)(b) Original images; (c)(d) ground truths; (e)(f) results of proposed method; (g)(h) results of basic U-Net model
Fig. 11. Comparison of algorithm performance
|
Table 1. Specifications of DSTL dataset at different bands
|
Table 2. Best threshold of each class
|
Table 3. Comparison of algorithm performance (Jaccard index)

Set citation alerts for the article
Please enter your email address
© Copyright 2018-2021 | Chinese Laser Press. All Rights Reserved 沪ICP备15018463号-20