
Yunzuo Zhang, Wenxuan Li, Panliang Yang. Segmentation of Surveillance Video of Motion Segments Based on Spatiotemporal Flow[J]. Laser & Optoelectronics Progress, 2022, 59(8): 0810012
- Laser & Optoelectronics Progress
- Vol. 59, Issue 8, 0810012 (2022)
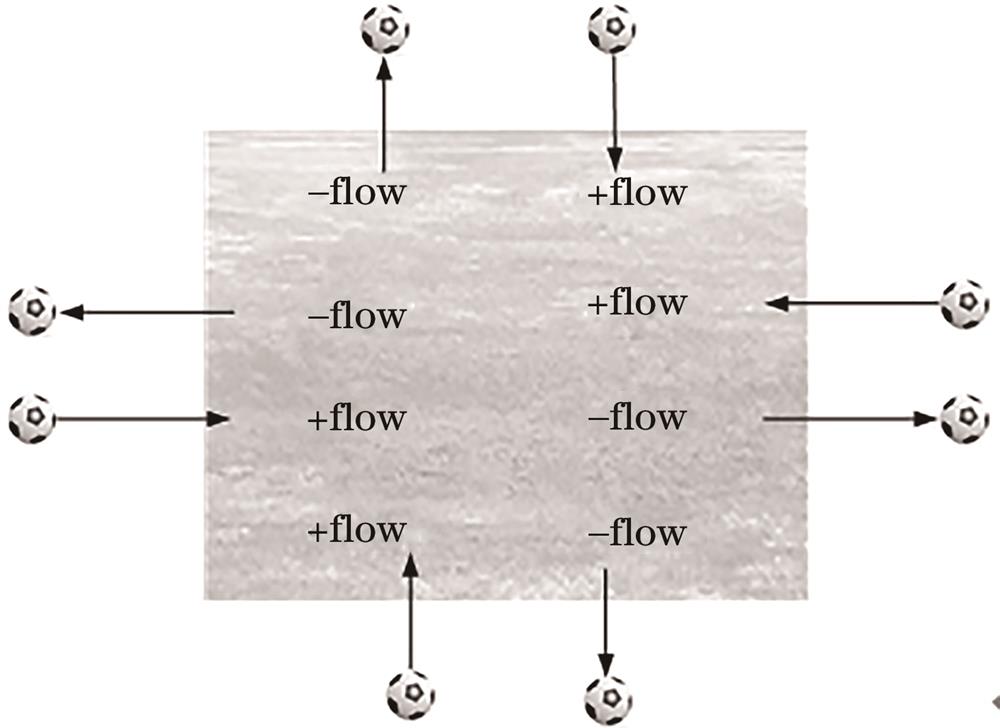
Fig. 1. Schematic of spatio-temporal flow model
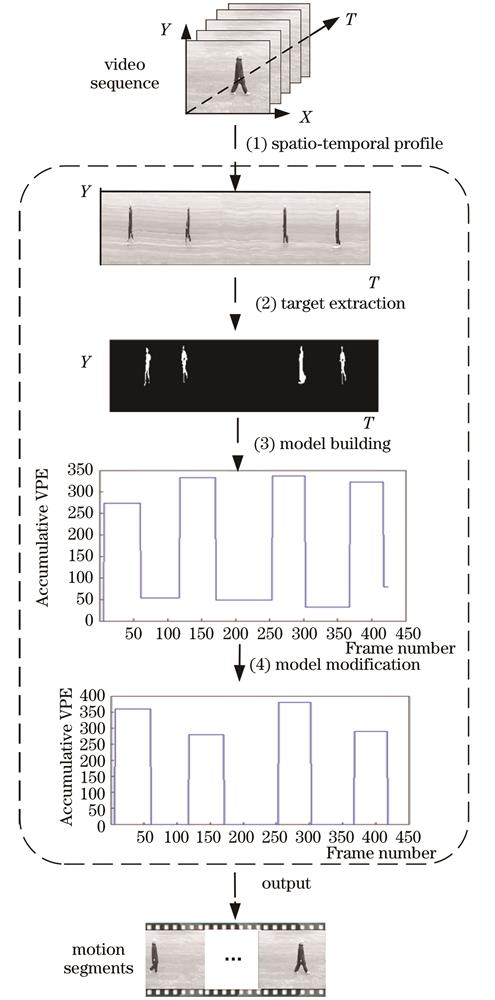
Fig. 2. Flow of surveillance video motion segment segmentation based on spatio-temporal flow
Fig. 3. Video frame boundaries and spatio-temporal profiles. (a) Frame boundaries; (b) spatio-temporal profiles
Fig. 4. Video spatio-temporal profiles
Fig. 5. Viewing the video profile as a video
Fig. 6. Spatio-temporal profiles after target extraction
Fig. 7. Schematic of the sub-boundary
Fig. 8. Video spatio-temporal flow curve and accumulative spatio-temporal flow curve. (a) Video spatio-temporal flow curve; (b) video accumulative spatio-temporal flow curve
Fig. 9. Corrected video spatio-temporal flow curve and corrected accumulative spatio-temporal flow curve. (a) Corrected video spatio-temporal flow curve; (b) corrected video accumulative spatio-temporal flow curve
Fig. 10. Schematic of self-collected surveillance videos
Fig. 11. Video4's spatio-temporal flow curve and accumulative spatio-temporal flow curve. (a) Spatio-temporal flow curve; (b) accumulative spatio-temporal flow curve
Fig. 12. Some of Video4's frames correspond to the spatio-temporal flow jumps
Fig. 13. Video5's accumulative spatio-temporal flow curve and partial video frames
|
Table 1. Basic information of experimental videos
|
Table 2. Comparison of experimental results

Set citation alerts for the article
Please enter your email address
© Copyright 2018-2021 | Chinese Laser Press. All Rights Reserved 沪ICP备15018463号-20