• Advanced Photonics
  • Vol. 5, Issue 5, 055001 (2023)
Qiangqiang Wang1、†, Jiqing Tan1, Qi Jie1, Hongxing Dong2、*, Yongsheng Hu1, Chun Zhou2, Saifeng Zhang3, Yichi Zhong2, Shuang Liang1、4, Long Zhang2、5, Wei Xie1、6、*, and Hongxing Xu1、4、*
Author Affiliations
  • 1East China Normal University, School of Physics and Electronic Science, State Key Laboratory of Precision Spectroscopy, Shanghai, China
  • 2Chinese Academy of Sciences, Shanghai Institute of Optics and Fine Mechanics, Key Laboratory of Materials for High-Power Laser, Shanghai, China
  • 3Shanghai University, Department of Physics, Shanghai, China
  • 4Wuhan University, School of Physics and Technology, Center for Nanoscience and Nanotechnology, Wuhan, China
  • 5University of Chinese Academy of Sciences, Hangzhou Institute for Advanced Study, Hangzhou, China
  • 6Chongqing Institute of East China Normal University, Chongqing Key Laboratory of Precision Optics, Chongqing, China
  • show less
    DOI: 10.1117/1.AP.5.5.055001 Cite this Article Set citation alerts
    Qiangqiang Wang, Jiqing Tan, Qi Jie, Hongxing Dong, Yongsheng Hu, Chun Zhou, Saifeng Zhang, Yichi Zhong, Shuang Liang, Long Zhang, Wei Xie, Hongxing Xu. Perturbation-driven echo-like superfluorescence in perovskite superlattices[J]. Advanced Photonics, 2023, 5(5): 055001 Copy Citation Text show less
    SF effect in perovskite QD superlattice. (a) Sketch of a superlattice sample assembled by CsPbBr3 QDs. The size of the individual cubic QDs is ∼10 nm, and the size of the assembled superlattices is distributed from submicrometers to micrometers. (b) Physical pictures of the excited states and the different radiation effects in corresponding samples. An exciton is shown as a pair of “±,” and the MDM is a collective state of a dipole ensemble with an MDM and a synchronous radiation phase. The yellow halo around the “±” pair presents the virtual light field. Dense excitons in a QD superlattice share the virtual light fields and from MDM. Black curved arrows describe the substantial radiation fields, i.e., the SE from individual excitons and the SF from cooperative excitons. (c) Time-integrated and time-resolved spectra. The SE signals from individual QDs and the SF signals from an assembled superlattice are measured under excitation densities of 6.1 and 5.8 μJ cm−2 per pulse, respectively. (d), (e) Excitation density ρ versus the time-resolved peak intensity Ipeak and the radiation decay time τrad. The dashed lines are guidelines for the trends y∝xm. Ipeak and τrad are obtained by fitting the time-resolved spectra under different excitation densities.
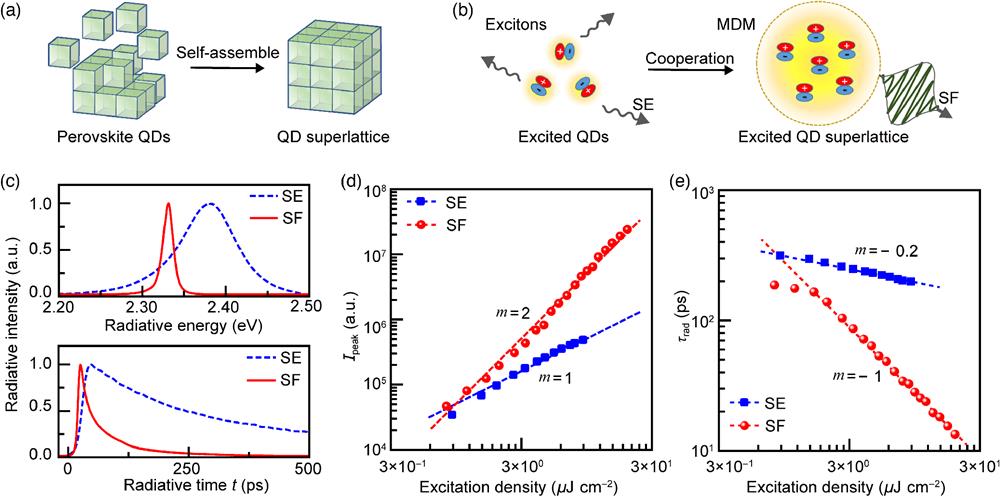
    Fig. 1. SF effect in perovskite QD superlattice. (a) Sketch of a superlattice sample assembled by CsPbBr3 QDs. The size of the individual cubic QDs is 10  nm, and the size of the assembled superlattices is distributed from submicrometers to micrometers. (b) Physical pictures of the excited states and the different radiation effects in corresponding samples. An exciton is shown as a pair of “±,” and the MDM is a collective state of a dipole ensemble with an MDM and a synchronous radiation phase. The yellow halo around the “±” pair presents the virtual light field. Dense excitons in a QD superlattice share the virtual light fields and from MDM. Black curved arrows describe the substantial radiation fields, i.e., the SE from individual excitons and the SF from cooperative excitons. (c) Time-integrated and time-resolved spectra. The SE signals from individual QDs and the SF signals from an assembled superlattice are measured under excitation densities of 6.1 and 5.8  μJcm2 per pulse, respectively. (d), (e) Excitation density ρ versus the time-resolved peak intensity Ipeak and the radiation decay time τrad. The dashed lines are guidelines for the trends yxm. Ipeak and τrad are obtained by fitting the time-resolved spectra under different excitation densities.
    Echo-like SF behavior under a controllable disturbance. (a)–(c) Time-resolved photoluminescence (PL) spectra at 10 K. The intensities are normalized by the intensity of the first peak. The arrows below the horizontal axis indicate the pulsed excitation times. The pulse densities Ex1st and Ex2nd are fixed at 5.4 and 3 μJ cm−2, respectively. The insets show the radiation energy/time-resolved mapping data. The row data at the spectral peak center are extracted and plotted in the corresponding main graph. (d) Comparison of the experimental results (I1, I2, I) and the comparison data (IC). The excitation parameters are the same as those in (a). (e) Zooming in the echo-like part in (d). (f) Disturbance-induced intensity variations (ΔIpeak2, ΔIdip) versus the disturbance injection moment (Δt). (g) Physical explanation of the echo-like radiation. The red (purple) spheres represent excitons pumped by Ex1st (Ex2nd). The brown arrows passing across spheres describe the cooperative radiation phase. The blue halo represents the laser field of Ex2nd, which adds new hot excitons to the previous cooperative exciton ensemble. The orange (green) background is the virtual light field shared by the cooperative (hot) excitons. The grid lines represent the QD units in the superlattice sample.
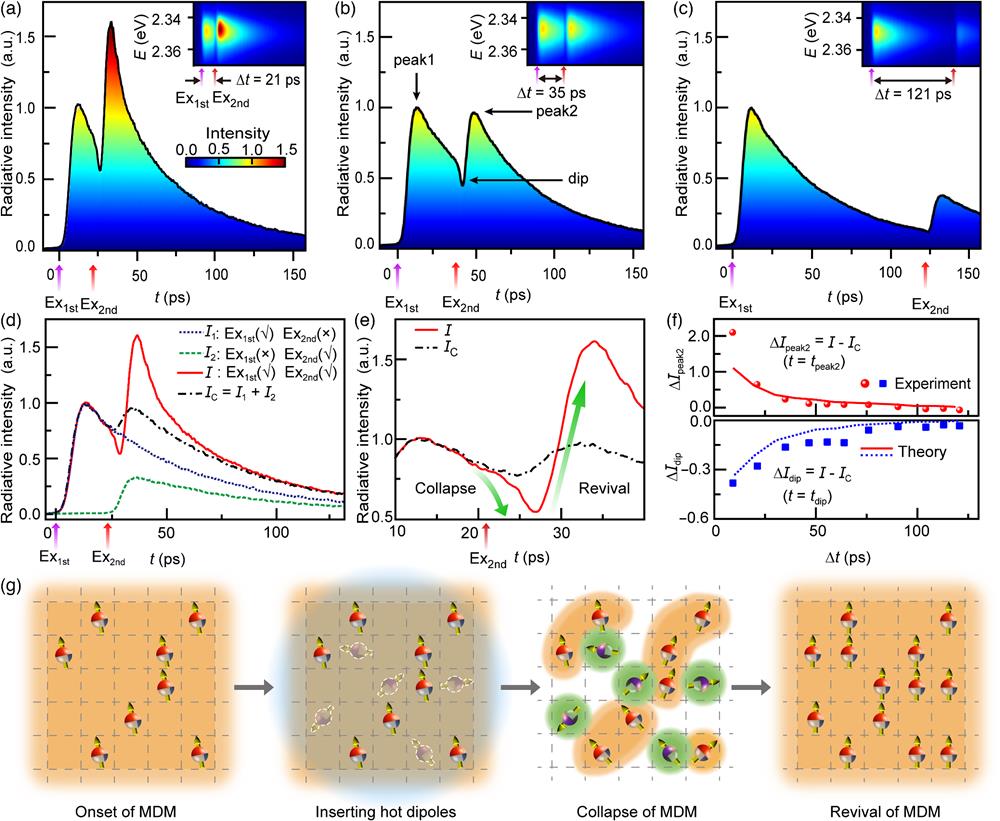
    Fig. 2. Echo-like SF behavior under a controllable disturbance. (a)–(c) Time-resolved photoluminescence (PL) spectra at 10 K. The intensities are normalized by the intensity of the first peak. The arrows below the horizontal axis indicate the pulsed excitation times. The pulse densities Ex1st and Ex2nd are fixed at 5.4 and 3  μJcm2, respectively. The insets show the radiation energy/time-resolved mapping data. The row data at the spectral peak center are extracted and plotted in the corresponding main graph. (d) Comparison of the experimental results (I1, I2, I) and the comparison data (IC). The excitation parameters are the same as those in (a). (e) Zooming in the echo-like part in (d). (f) Disturbance-induced intensity variations (ΔIpeak2, ΔIdip) versus the disturbance injection moment (Δt). (g) Physical explanation of the echo-like radiation. The red (purple) spheres represent excitons pumped by Ex1st (Ex2nd). The brown arrows passing across spheres describe the cooperative radiation phase. The blue halo represents the laser field of Ex2nd, which adds new hot excitons to the previous cooperative exciton ensemble. The orange (green) background is the virtual light field shared by the cooperative (hot) excitons. The grid lines represent the QD units in the superlattice sample.
    Echo-like SF behavior versus the temperature of crystal lattice. (a) Temperature-dependent cooperation state of the exciton ensemble, which is determined by the competition of two mechanisms, i.e., the cooperative mechanism via the virtual light field (represented by orange/green background) and the dephasing mechanism via phonon scattering (represented by the twisted lattice). The state of the exciton ensemble changes from “cooperative” at 10 K to “partially cooperative” at 50 K and “noncooperative” at 100 K. (b) Radiation response for an exciton ensemble at different temperatures. The data shown by solid lines are excited by Ex1st and Ex2nd with a fixed pulse density of ρEx1=5.4 μJ cm−2, ρEx2=2.4 μJ cm−2 and an interval time of Δt=20 ps. The data shown by dashed lines are excited by Ex1st only.
    Fig. 3. Echo-like SF behavior versus the temperature of crystal lattice. (a) Temperature-dependent cooperation state of the exciton ensemble, which is determined by the competition of two mechanisms, i.e., the cooperative mechanism via the virtual light field (represented by orange/green background) and the dephasing mechanism via phonon scattering (represented by the twisted lattice). The state of the exciton ensemble changes from “cooperative” at 10 K to “partially cooperative” at 50 K and “noncooperative” at 100 K. (b) Radiation response for an exciton ensemble at different temperatures. The data shown by solid lines are excited by Ex1st and Ex2nd with a fixed pulse density of ρEx1=5.4  μJcm2, ρEx2=2.4  μJcm2 and an interval time of Δt=20  ps. The data shown by dashed lines are excited by Ex1st only.
    Echo-like SF behavior versus the disturbance strength. (a) Radiation dynamics for different disturbance amplitudes. Other excitation parameters (Δt=10 ps, T=10 K, and ρEx1=5.4 μJ cm−2) are fixed. All curves are normalized to the intensity of the first peak, and each curve is equally spaced along the vertical axis for clarity. (b) Comparison of three disturbance cases. The dip region (dashed box) is further magnified. (c) Echo-like SF versus disturbance amplitude. The radiation intensities without and with the disturbance are shown as black and colored lines, respectively. The largest dip occurs at a moderate disturbance amplitude ρEx2=1.8 μJ cm−2, depending on the competition between scattering dephasing and the rebuilding rate of the MDM.
    Fig. 4. Echo-like SF behavior versus the disturbance strength. (a) Radiation dynamics for different disturbance amplitudes. Other excitation parameters (Δt=10  ps, T=10  K, and ρEx1=5.4  μJcm2) are fixed. All curves are normalized to the intensity of the first peak, and each curve is equally spaced along the vertical axis for clarity. (b) Comparison of three disturbance cases. The dip region (dashed box) is further magnified. (c) Echo-like SF versus disturbance amplitude. The radiation intensities without and with the disturbance are shown as black and colored lines, respectively. The largest dip occurs at a moderate disturbance amplitude ρEx2=1.8  μJcm2, depending on the competition between scattering dephasing and the rebuilding rate of the MDM.
    Qiangqiang Wang, Jiqing Tan, Qi Jie, Hongxing Dong, Yongsheng Hu, Chun Zhou, Saifeng Zhang, Yichi Zhong, Shuang Liang, Long Zhang, Wei Xie, Hongxing Xu. Perturbation-driven echo-like superfluorescence in perovskite superlattices[J]. Advanced Photonics, 2023, 5(5): 055001
    Download Citation