
Zhihong Xi, Kunpeng Yuan. Super-Resolution Image Reconstruction Based on Residual Channel Attention and Multilevel Feature Fusion[J]. Laser & Optoelectronics Progress, 2020, 57(4): 041504
- Laser & Optoelectronics Progress
- Vol. 57, Issue 4, 041504 (2020)
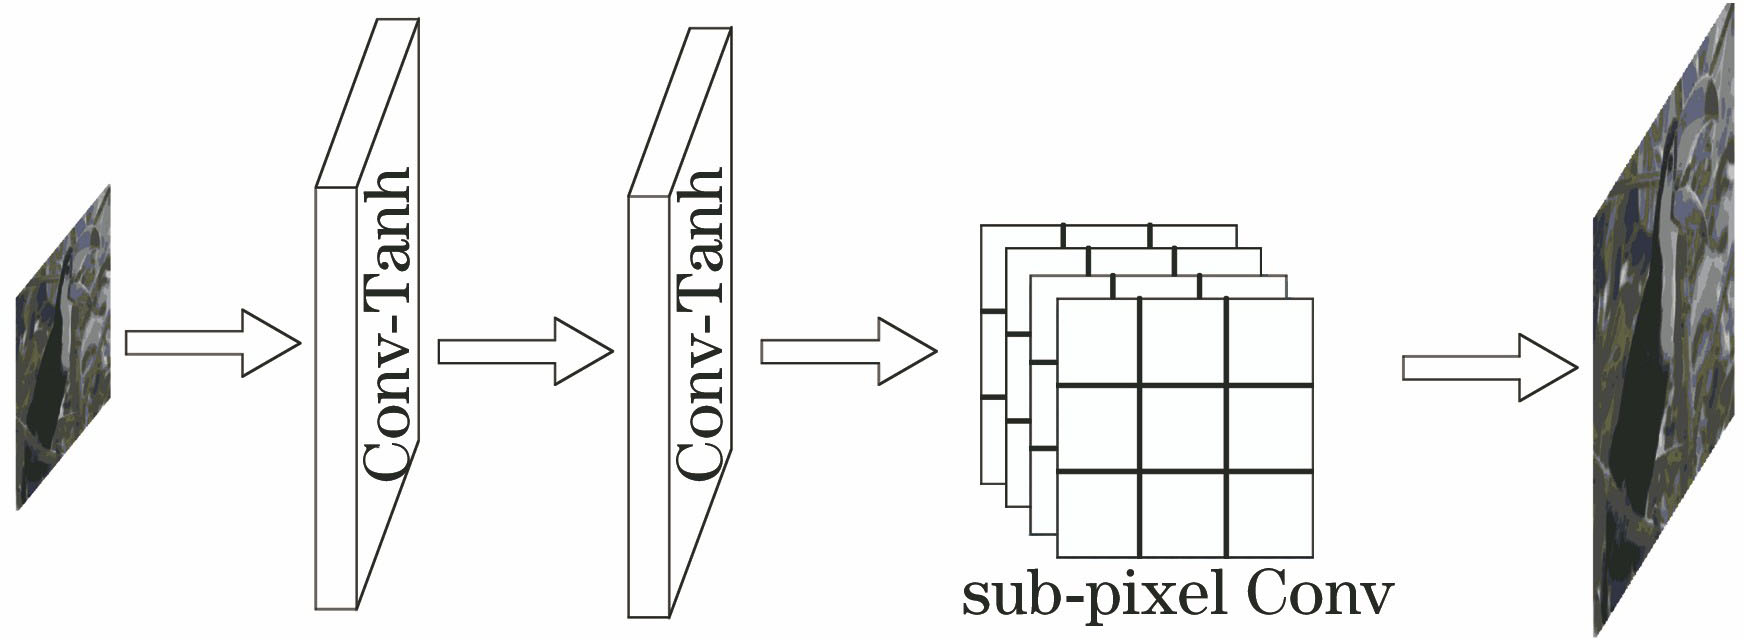
Fig. 1. Structure of ESPCN network
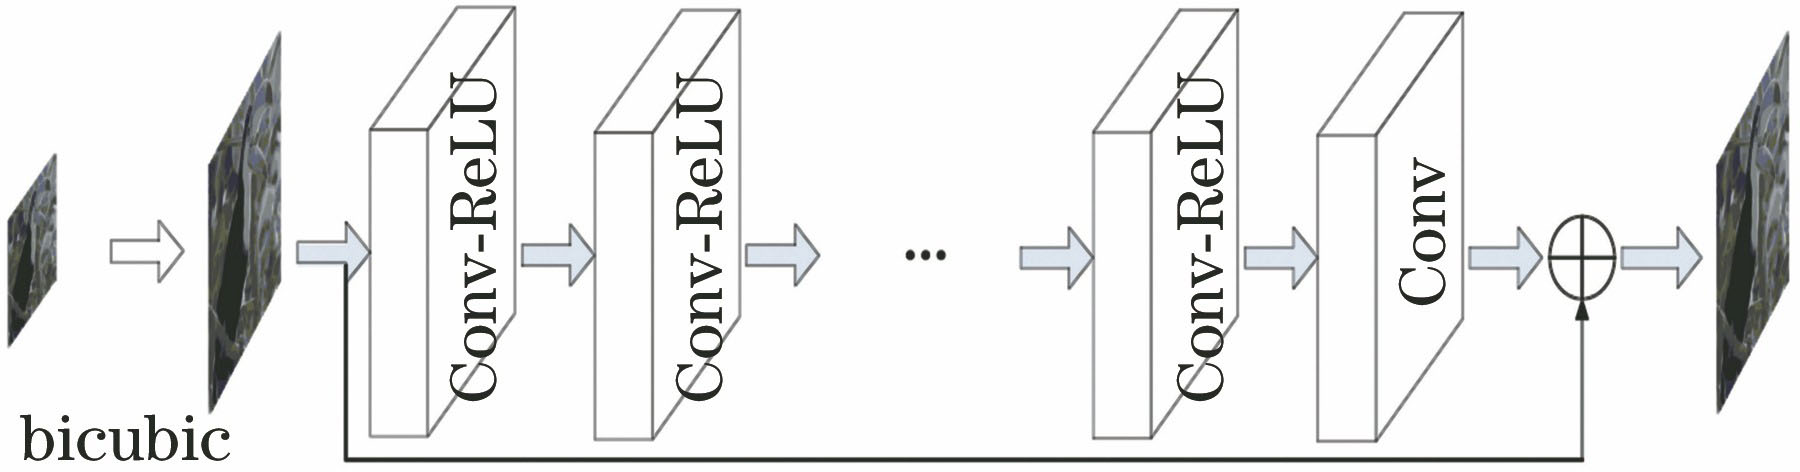
Fig. 2. Structure of VDSR network
Fig. 3. Network structure of proposed algorithm
Fig. 4. Recursive unit module. (a) Recursive unit module composition; (b) residual channel attention; (c) multilevel feature fusion
Fig. 5. Variation of mean PSNR with the number of iterations for different layers at Set5 test set
Fig. 6. Relationship between number of parameters of different network structures and mean PSNR at Set5 test set
Fig. 7. Relationship between run time of different methods and mean PSNR at Set5 test set
Fig. 8. Comparison of zebra image recovered with different algorithms
Fig. 9. Comparison of ppt image recovered with different algorithms
|
Table 1. Means PSNR of different RCAF model components at Set 5 test set
|
Table 2. Mean PSNR of different algorithms at Set5, Set14, and BSD100 test sets
|
Table 3. Mean SSIM of different algorithms at test sets Set5, Set14, and BSD100

Set citation alerts for the article
Please enter your email address
© Copyright 2018-2021 | Chinese Laser Press. All Rights Reserved 沪ICP备15018463号-20