• Laser & Optoelectronics Progress
  • Vol. 58, Issue 9, 0901002 (2021)
Pengcheng Jia1、**, Nianwen Cao1、*, Guangqiang Fan2, and Yirui Zhao1
Author Affiliations
  • 1Key Laboratory for Aerosol-Cloud-Precipitation of China Meteorological Administration, Nanjing , Jiangsu 210044, China
  • 2Anhui Institute of Optics and Fine Mechanics, Chinese Academy of Sciences, Hefei , Anhui 230031, China
  • show less
    DOI: 10.3788/LOP202158.0901002 Cite this Article Set citation alerts
    Pengcheng Jia, Nianwen Cao, Guangqiang Fan, Yirui Zhao. Differential Absorption Lidar Monitoring of Heavy Pollution Process[J]. Laser & Optoelectronics Progress, 2021, 58(9): 0901002 Copy Citation Text show less
    Structure of the differential absorption lidar
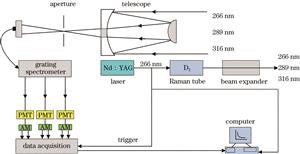
    Fig. 1. Structure of the differential absorption lidar
    Surface weather changes during the observation period. (a) Visibility and mass concentration of the particulate matter; (b) precipitation and air pressure; (c) relative humidity and temperature; (d) wind direction and speed
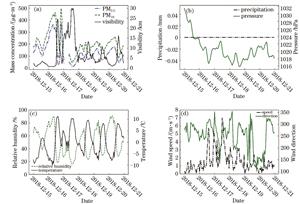
    Fig. 2. Surface weather changes during the observation period. (a) Visibility and mass concentration of the particulate matter; (b) precipitation and air pressure; (c) relative humidity and temperature; (d) wind direction and speed
    Changes in the mass concentration of pollutants during the observation period. (a) Particulate matter; (b) O3 and NO2; (c) CO and SO2
    Fig. 3. Changes in the mass concentration of pollutants during the observation period. (a) Particulate matter; (b) O3 and NO2; (c) CO and SO2
    Temperature sounding profile during the observation period. (a) 16th; (b) 17th; (c) 18th; (d) 19th ; (e) 20th; (f) 21st
    Fig. 4. Temperature sounding profile during the observation period. (a) 16th; (b) 17th; (c) 18th; (d) 19th ; (e) 20th; (f) 21st
    Height field of the 850 hPa potential. (a) 15th; (b) 16th; (c) 17th; (d) 18th; (e) 19th; (f) 20th
    Fig. 5. Height field of the 850 hPa potential. (a) 15th; (b) 16th; (c) 17th; (d) 18th; (e) 19th; (f) 20th
    Wind field with a height of 10 m. (a) 15th; (b) 16th; (c) 17th; (d) 18th; (e) 19th; (f) 20th
    Fig. 6. Wind field with a height of 10 m. (a) 15th; (b) 16th; (c) 17th; (d) 18th; (e) 19th; (f) 20th
    Time and space distribution of pollutants measured by differential absorption lidar. (a) Particle extinction coefficient; (b) O3 mass concentration
    Fig. 7. Time and space distribution of pollutants measured by differential absorption lidar. (a) Particle extinction coefficient; (b) O3 mass concentration
    Aerosol extinction coefficient at different moments
    Fig. 8. Aerosol extinction coefficient at different moments
    O3 mass concentration at different moments
    Fig. 9. O3 mass concentration at different moments
    Dackward trajectory of the air mass from 2018-12-15T19:00—2018-12-17T19:00
    Fig. 10. Dackward trajectory of the air mass from 2018-12-15T19:00—2018-12-17T19:00
    NAAPS simulated aerosol. (a) 2018-12-15T08:00; (b) 2018-12-16T08:00; (c) 2018-12-16T20:00; (d) 2018-12-17T02:00
    Fig. 11. NAAPS simulated aerosol. (a) 2018-12-15T08:00; (b) 2018-12-16T08:00; (c) 2018-12-16T20:00; (d) 2018-12-17T02:00
    FactorPM2.5O3PBLHRHTVISWSPRES
    PM2.51.0-0.54***0.0030.637***-0.608***-0.640***-0.433***0.369***
    O31.0-0.30**-0.76***0.80***0.88***-0.74***-0.30**
    PBLH1.00.368***-0.280**-0.344***-0.418***0.220*
    RH1.0-0.958***-0.774***-0.700***0.396***
    T1.00.750***0.696***-0.349***
    VIS1.00.800***-0.244*
    WS1.0-0.176
    PRES1.0
    Table 1. Correlation coefficients of PM2.5, O3 mass concentrations and boundary layer height, other meteorological elements
    Pengcheng Jia, Nianwen Cao, Guangqiang Fan, Yirui Zhao. Differential Absorption Lidar Monitoring of Heavy Pollution Process[J]. Laser & Optoelectronics Progress, 2021, 58(9): 0901002
    Download Citation