Author Affiliations
1Tianjin Key Laboratory of Optoelectronic Detection Technology and System, School of Electronics and Information Engineering, Tiangong University, Tianjin 300387, China2Engineering Research Center of Ministry of Education on High Power Solid State Lighting Application System, Tianjin 300387, Chinashow less
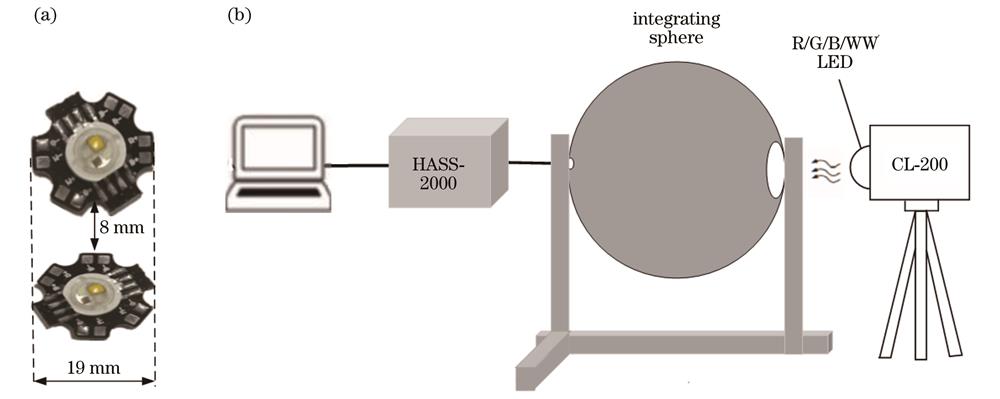
Fig. 1. Schematic diagram of light source and experimental setup. (a) Light source; (b) experimental setup
Fig. 2. Spectral power distribution of R/G/B/WW LED light source at different temperatures
Fig. 3. Color rendering index of mixed white light at different correlated color temperatures. (a) 3000 K; (b) 5000 K; (c) 6500 K
Fig. 4. Comparison between measured and model calculated results under different correlated color temperatures. (a) 3000 K; (b) 5000 K; (c) 6500 K
Fig. 5. Measured parameter of light source under correlated color temperatures of 3000 K, 5000 K and 6500 K. (a) TC and EV; (b) CAF and
Fig. 6. Comparison between measured and compensation model spectra under different correlated color temperatures. (a) 3000 K; (b) 5000 K; (c) 6500 K
Model | R | G | B | Part I in WW | Part II in WW |
---|
Gaussian model | 0.985 | 0.994 | 0.992 | 0.988 | 0.991 | Gauss-Lorentz model | 0.970 | 0.988 | 0.984 | 0.972 | 0.986 | model | 0.972 | 0.991 | 0.989 | 0.992 | 0.996 |
|
Table 1. Fitting coefficients of three models of R/G/B/WW four-color LED light source
Correlated color temperature /K | Error in TC /% | Error in EV /% | Error in Ra /% | Error in CAF /% | /% |
---|
3000 | 3.79(70 ℃) | 1.45(20 ℃) | 3.25(30 ℃) | 2.92(30 ℃) | 2.94(80 ℃) | 5000 | 2.67(70 ℃) | 1.38(40 ℃) | 2.10(20 ℃) | 2.77(90 ℃) | 3.66(90 ℃) | 6500 | 1.56(90 ℃) | 1.14(40 ℃) | 2.66(80 ℃) | 3.34(70 ℃) | 2.52(90 ℃) |
|
Table 2. Comparison errors between experimental and model light source parameter values under correlated color temperatures of 3000 K, 5000 K and 6500 K
Correlated color temperature /K | Set T /℃ | Measured TC /K | Relative error of TC /% | Measured EV /lx | Relative error of EV /% | Measured CAF | Relative error of CAF /% | Measured | Relative error of /% |
---|
3000 | 30 | 3109 | 0.98 | 83.99 | 0.51 | 0.4101 | 1.74 | 0.1001 | 1.62 | 40 | 3119 | 0.66 | 83.55 | 1.03 | 0.4102 | 1.76 | 0.1002 | 1.73 | 50 | 3131 | 0.26 | 83.51 | 1.07 | 0.4101 | 1.74 | 0.1003 | 1.83 | 60 | 3140 | 0.12 | 83.18 | 1.47 | 0.4104 | 1.81 | 0.1001 | 1.62 | 70 | 3164 | 0.79 | 82.91 | 1.79 | 0.4103 | 1.79 | 0.1002 | 1.73 | 80 | 3175 | 1.12 | 82.74 | 1.99 | 0.4102 | 1.76 | 0.1002 | 1.73 | 90 | 3199 | 1.91 | 82.43 | 2.35 | 0.4105 | 1.84 | 0.1003 | 1.83 | 5000 | 30 | 5098 | 0.42 | 92.90 | 0.13 | 0.7422 | 0.63 | 0.2169 | 1.40 | 40 | 5112 | 0.09 | 92.70 | 0.40 | 0.7449 | 0.28 | 0.2173 | 1.59 | 50 | 5128 | 0.22 | 92.00 | 1.07 | 0.7478 | 0.12 | 0.2178 | 1.82 | 60 | 5145 | 0.41 | 92.70 | 0.38 | 0.7502 | 0.44 | 0.2184 | 2.10 | 70 | 5154 | 0.69 | 92.10 | 1.06 | 0.7531 | 0.83 | 0.2187 | 2.24 | 80 | 5169 | 1.09 | 92.50 | 0.53 | 0.7546 | 1.03 | 0.2192 | 2.47 | 90 | 5189 | 1.48 | 92.90 | 0.06 | 0.7563 | 1.26 | 0.2195 | 2.62 | 6500 | 30 | 6517 | 0.99 | 99.70 | 1.36 | 0.9315 | 1.31 | 0.2718 | 0.80 | 40 | 6526 | 0.85 | 99.30 | 0.98 | 0.9316 | 1.30 | 0.2724 | 0.58 | 50 | 6554 | 0.43 | 98.60 | 0.30 | 0.9314 | 1.32 | 0.2729 | 0.40 | 60 | 6571 | 0.18 | 97.60 | 0.75 | 0.9337 | 1.08 | 0.2734 | 0.22 | 70 | 6596 | 0.21 | 98.80 | 0.42 | 0.9345 | 0.99 | 0.2737 | 0.11 | 80 | 6627 | 0.68 | 97.50 | 0.85 | 0.9367 | 0.76 | 0.2741 | 0.04 | 90 | 6653 | 1.07 | 97.00 | 1.34 | 0.9386 | 0.56 | 0.2746 | 0.22 |
|
Table 3. Relative errors between measured values and set values at different correlated color temperatures and temperatures after compensation