
Jia-Lu MA, Jing-Chao TANG, Kai-Cheng WANG, Liang-Hao GUO, Shao-Meng WANG, Yu-Bin GONG. A THz-TDS based metamaterial sensor for the sensitive distinguishment of food additives[J]. Journal of Infrared and Millimeter Waves, 2022, 41(3): 581
- Journal of Infrared and Millimeter Waves
- Vol. 41, Issue 3, 581 (2022)
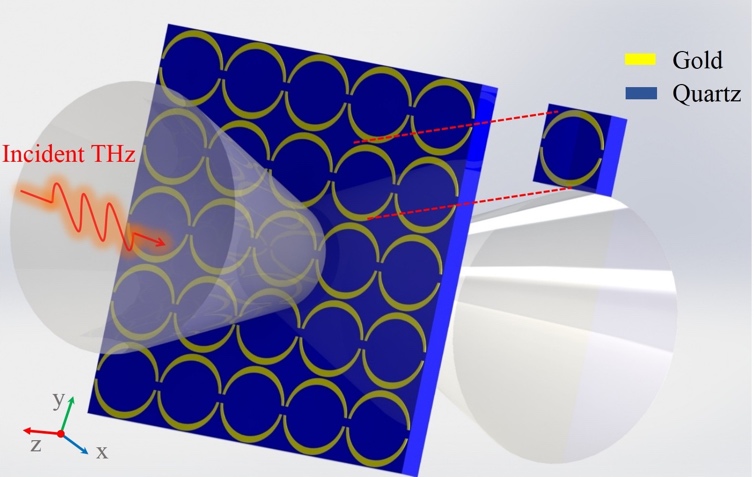
Fig. 1. The geometric diagram of the proposed metamaterial sensor based on SRR structure
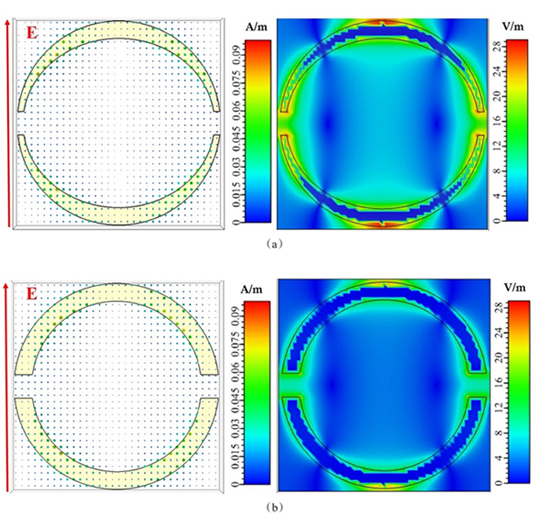
Fig. 2. The surface current and electric field profiles of SRR structure (a) with and (b) without tip ends, the red colored y-axis signifies the polarization direction of the incident electric field
Fig. 3. The optical microscopy images of the fabricated metamaterial sensor (a) array structure of SRR, (b) single structure of SRR
Fig. 4. (a) Sensor assembled with fixture, (b) measurement platform of the THz-TDS system
Fig. 5. (a) Simulated transmission spectra of metamaterial sensor for different refractive index analyte with the thickness of 0.4 μm, (b) simulated transmission spectra of metamaterial sensor for different thickness analyte with the refractive index of 1.2
Fig. 6. (a) and (b) represent the relationship between frequency shift and refractive index and the relationship between frequency shift and the thickness of sample film, respectively
Fig. 7. (a), (b) and (c) represent the measured transmission spectra of inositol (IS), leucine (LC), and taurine (TR) with different concentrations, respectively
Fig. 8. (a) and (b) represent the relationship between frequency shift and concentration of inositol (IS) and leucine (LC) solution changing from 0.2 to 4 mg/ml, respectively
Fig. 9. The measured transmission spectra of inositol(IS),leucine(LC),and taurine(TR)with the solution concentration of 4 mg/ml
|
Table 1. Parameter values of the proposed metamaterial sensor

Set citation alerts for the article
Please enter your email address
© Copyright 2018-2021 | Chinese Laser Press. All Rights Reserved 沪ICP备15018463号-20