• Acta Optica Sinica
  • Vol. 38, Issue 3, 328004 (2018)
Yang Yuanhong*, Yang Fuling, Lu Lin, Li Hui, and Li Shuai
Author Affiliations
  • [in Chinese]
  • show less
    DOI: 10.3788/AOS201838.0328004 Cite this Article Set citation alerts
    Yang Yuanhong, Yang Fuling, Lu Lin, Li Hui, Li Shuai. Research on Interferometer Photonic Crystal Fiber Optic Gyroscope Technology[J]. Acta Optica Sinica, 2018, 38(3): 328004 Copy Citation Text show less
    Section images. (a)PM-PCFs; (b)HCFs
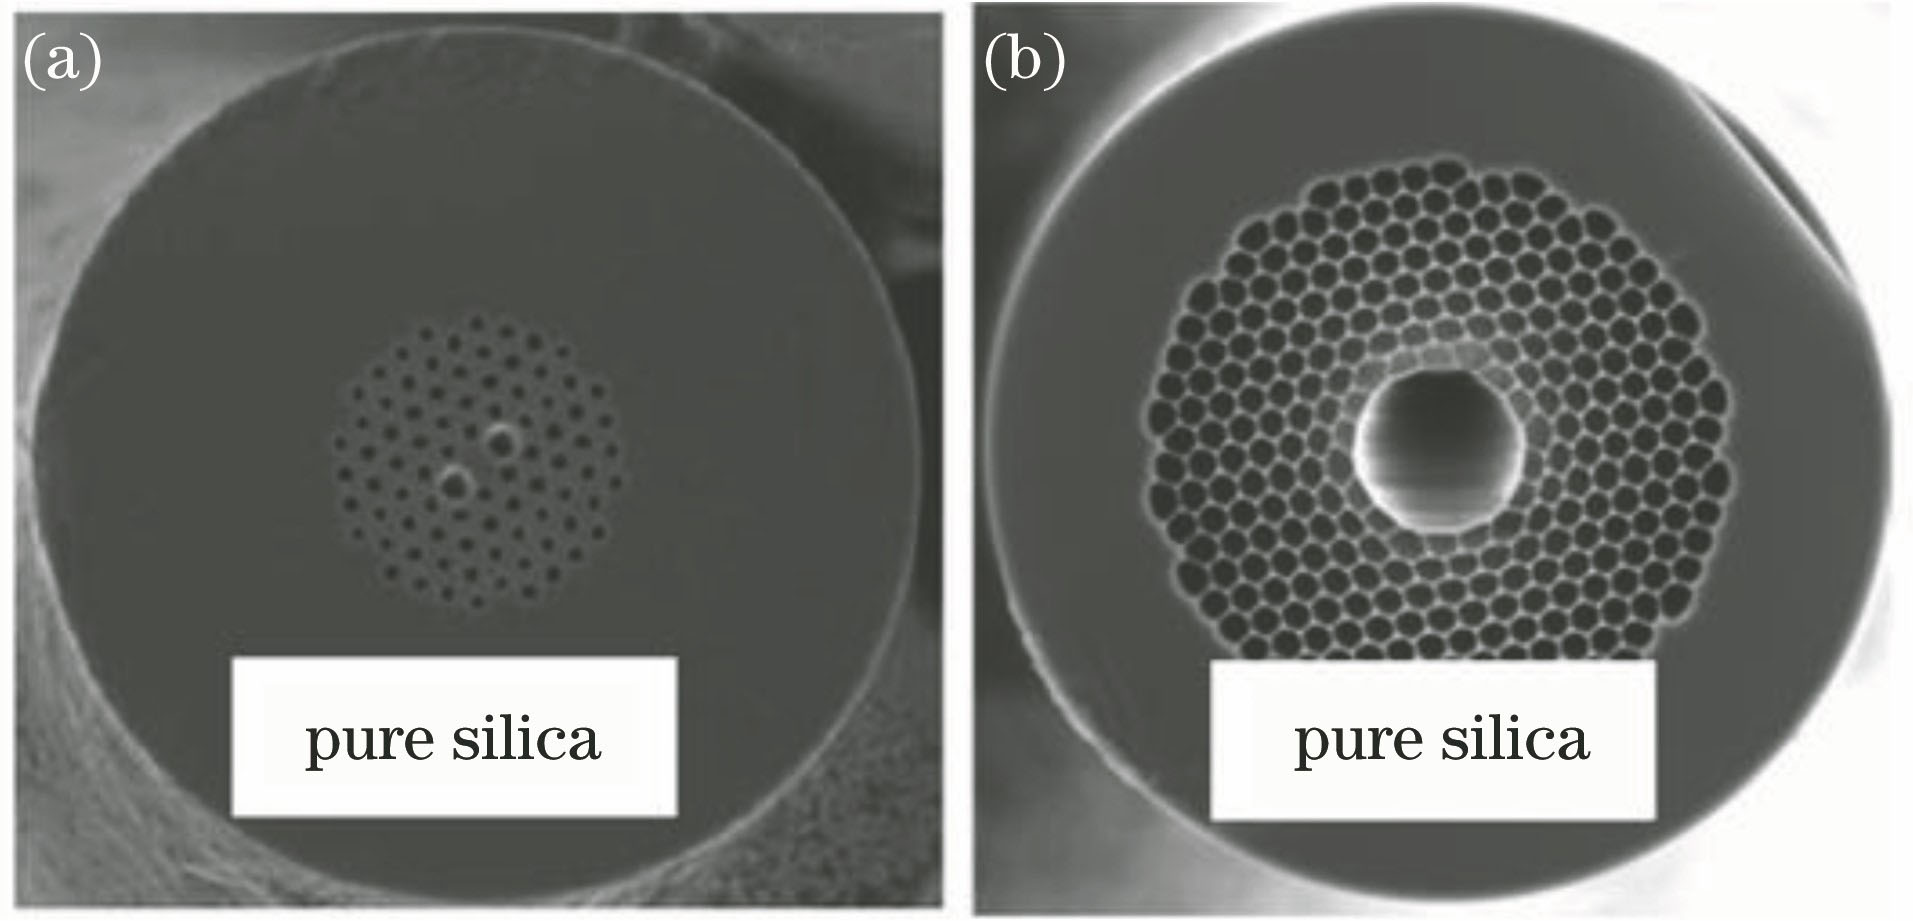
    Fig. 1. Section images. (a)PM-PCFs; (b)HCFs
    Basic configuration of PCFOG
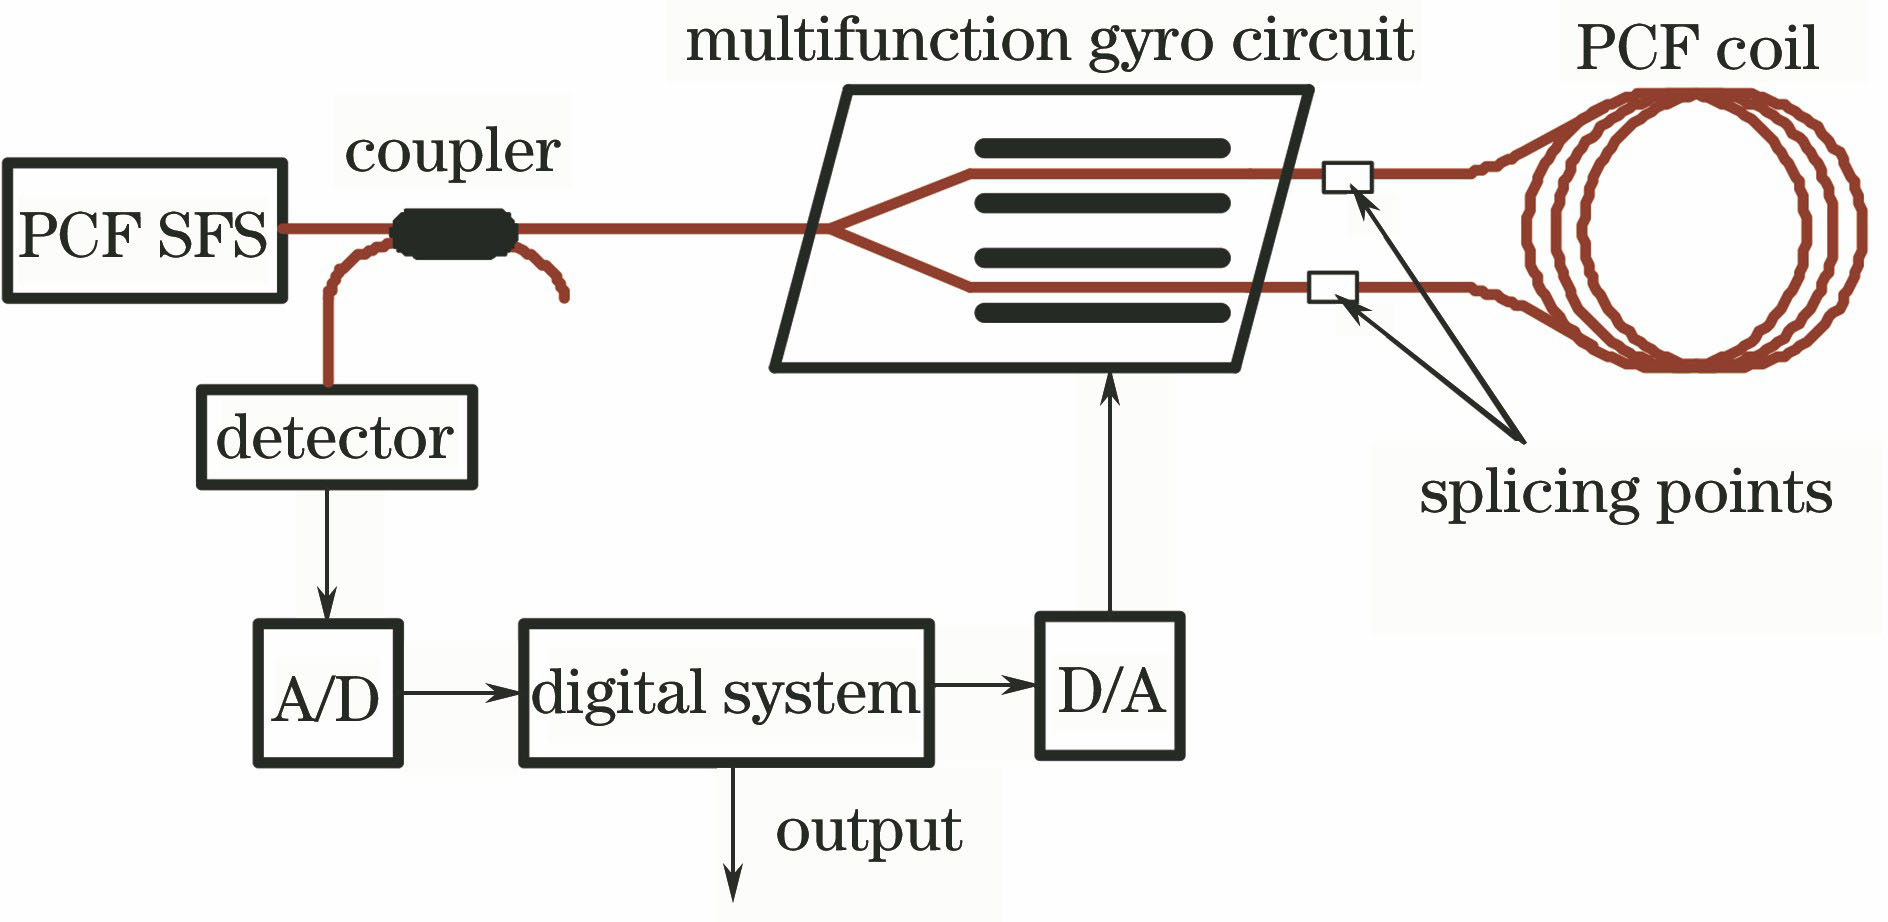
    Fig. 2. Basic configuration of PCFOG
    Section image of a typical PM-PCFs
    Fig. 3. Section image of a typical PM-PCFs
    Dependence of birefringence on Λ
    Fig. 4. Dependence of birefringence on Λ
    Relationship between birefringence temperature sensitivity coefficient and Λ
    Fig. 5. Relationship between birefringence temperature sensitivity coefficient and Λ
    Measured birefringence temperature sensitivity coefficient under different Λ
    Fig. 6. Measured birefringence temperature sensitivity coefficient under different Λ
    Relationship between birefringence variation and radiation dose
    Fig. 7. Relationship between birefringence variation and radiation dose
    Image of ED-PCFs cross section
    Fig. 8. Image of ED-PCFs cross section
    Radiation comparison experiment of EDFs. (a) M-12; (b) ED-PCFs
    Fig. 9. Radiation comparison experiment of EDFs. (a) M-12; (b) ED-PCFs
    Schematic of 1×N fiber coupling
    Fig. 10. Schematic of 1×N fiber coupling
    Ending and side view of PMFs and PM-PCFs in welding machine
    Fig. 11. Ending and side view of PMFs and PM-PCFs in welding machine
    Relationship between fusion loss and fusion current
    Fig. 12. Relationship between fusion loss and fusion current
    (a) Configuration of PCFOG prototype; (b) photograph of three-axis PCFOG prototype
    Fig. 13. (a) Configuration of PCFOG prototype; (b) photograph of three-axis PCFOG prototype
    Typical performance curve of PCFOG. (a) Static testing; (b) Allan variance; (c) scale factor
    Fig. 14. Typical performance curve of PCFOG. (a) Static testing; (b) Allan variance; (c) scale factor
    Photograph of radiation experiment scene
    Fig. 15. Photograph of radiation experiment scene
    NumberΛ/μmDe /μmLB/mmdB/dT /(10-9-1)
    14.4105.83.12-4.390
    24.9117.83.21-1.206
    35.0120.24.40-0.707
    45.3127.45.330.525
    55.6134.66.311.010
    Table 1. Main parameters of PM-PCFs samples
    Fiber modelEDFs (M-12)ED-PCFs
    Absorbility@1530 nm/(dB·m-1)18.7952
    Absorbility @980 nm/(dB·m-1)11.536
    Diameter of mode field@1550 nm/μm6.16.5
    Cut-off wavelength /nm930-
    Table 2. Main characteristic parameters of two EDFs
    Current /mAIntensity distributionLength of long axis /μmLength of short axis /μmEllipticity
    0.004.722.551.85
    10.05.172.951.75
    11.05.583.221.73
    12.0---
    Table 3. 3D images and parameters of measured transmission mode field
    Yang Yuanhong, Yang Fuling, Lu Lin, Li Hui, Li Shuai. Research on Interferometer Photonic Crystal Fiber Optic Gyroscope Technology[J]. Acta Optica Sinica, 2018, 38(3): 328004
    Download Citation