• Photonics Research
  • Vol. 8, Issue 9, 1416 (2020)
Yang Gao1, Xin Qiu1, Fuli Zhao2、3, Shuyu Xiao1, Junzi Li1, Xiaodong Lin1, Rui Chen2、4、*, and Tingchao He1、5、*
Author Affiliations
  • 1College of Physics and Optoelectronic Engineering, Shenzhen University, Shenzhen 518060, China
  • 2Department of Electrical and Electronic Engineering, Southern University of Science and Technology, Shenzhen 518055, China
  • 3College of Arts and Science, Shanghai Dianji University, Shanghai 201306, China
  • 4e-mail: chenr@sustech.edu.cn
  • 5e-mail: tche@szu.edu.cn
  • show less
    DOI: 10.1364/PRJ.387099 Cite this Article Set citation alerts
    Yang Gao, Xin Qiu, Fuli Zhao, Shuyu Xiao, Junzi Li, Xiaodong Lin, Rui Chen, Tingchao He. Linear and nonlinear photophysical properties of ZnSe/CdS/ZnS core/shell/shell type II nanocrystals[J]. Photonics Research, 2020, 8(9): 1416 Copy Citation Text show less
    (a) TEM image of ZnSe/CdS/ZnS NCs. Inset: their schematic structure. (b) The absorption, PL (excited at 365 nm), and PLE spectra of NCs. The inset shows their colloidal solutions under UV illumination (λ=365 nm). (c) The diameter distribution of the NCs. (d) Time-dependent PL intensity of ZnSe/CdS/ZnS NCs detected at 630 nm.
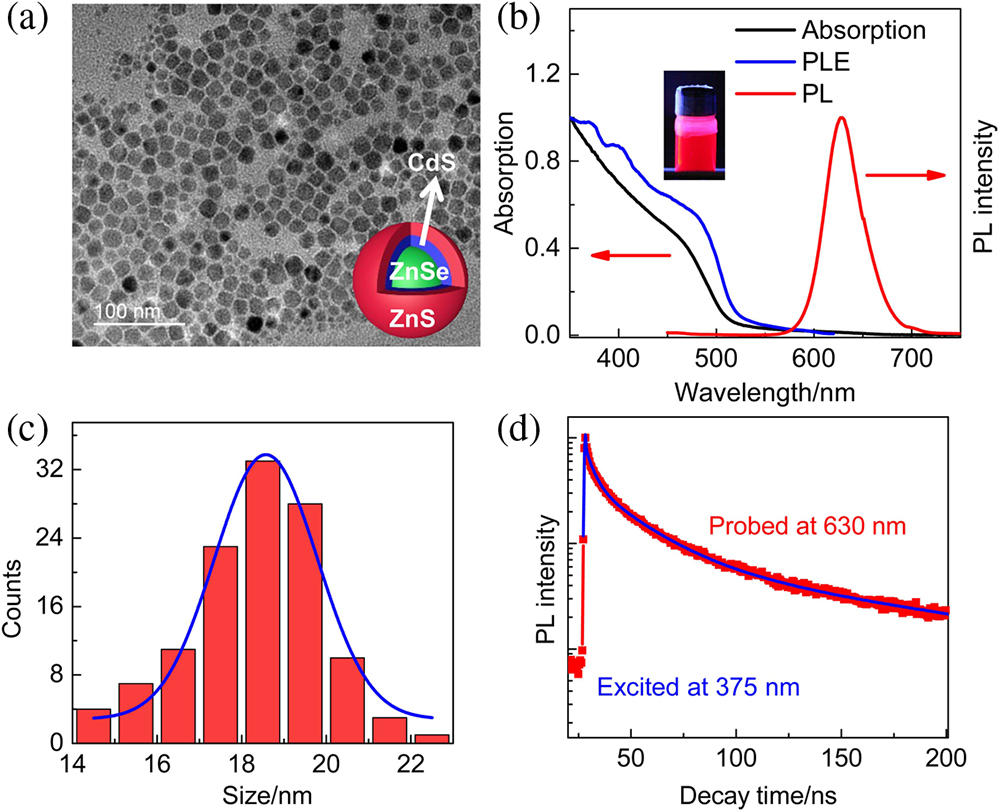
    Fig. 1. (a) TEM image of ZnSe/CdS/ZnS NCs. Inset: their schematic structure. (b) The absorption, PL (excited at 365 nm), and PLE spectra of NCs. The inset shows their colloidal solutions under UV illumination (λ=365  nm). (c) The diameter distribution of the NCs. (d) Time-dependent PL intensity of ZnSe/CdS/ZnS NCs detected at 630 nm.
    (a) Temperature-dependent PL mapping of ZnSe/CdS/ZnS NCs under an excitation of 325 nm. The white line indicates a guidance line to the eyes. (b) The comparison of normalized PL spectra of NCs was performed at 10 and 300 K. (c) Temperature-dependent peak energies, where the line is the fitting curve according to Eq. (1). (d) Temperature dependence of the PL FWHM of NCs. The solid line is the fitting according to Eq. (2).
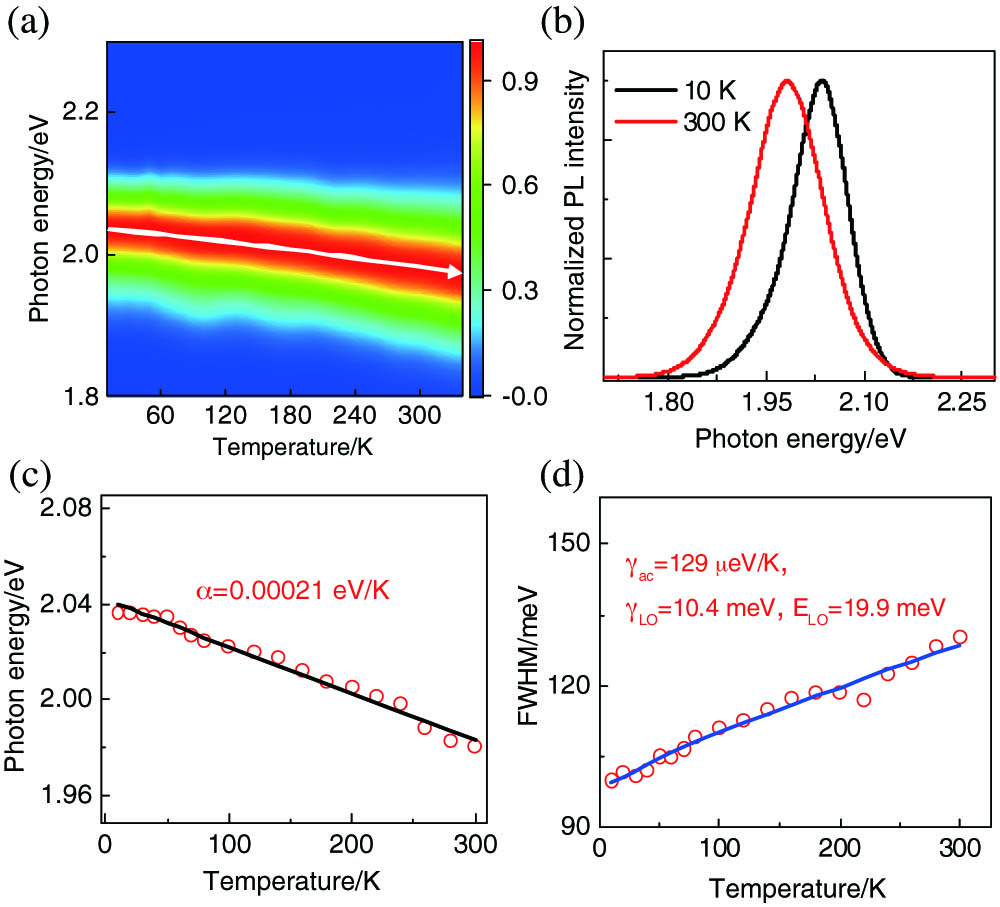
    Fig. 2. (a) Temperature-dependent PL mapping of ZnSe/CdS/ZnS NCs under an excitation of 325 nm. The white line indicates a guidance line to the eyes. (b) The comparison of normalized PL spectra of NCs was performed at 10 and 300 K. (c) Temperature-dependent peak energies, where the line is the fitting curve according to Eq. (1). (d) Temperature dependence of the PL FWHM of NCs. The solid line is the fitting according to Eq. (2).
    (a), (b) fs-TA spectra of ZnSe/CdS/ZnS NCs excited at 400 nm (core excitation) and 600 nm (interfacial state excitation), respectively. (c) Temporal dynamics of the bleaching recovery curves for the ZnSe core (460 nm), CdS shell (500 nm), and interfacial state (625 nm), under the core excitation. Inset: the bandgap alignment of ZnSe and CdS. (d) fs-TA spectra of ZnSe/CdS/ZnS NCs at different delay times. The inset shows time-dependent shifting of interfacial state bleaching toward longer wavelengths, under the 400 nm excitation. (e) Temporal evolution of the spectral position for the interfacial state bleaching.
    Fig. 3. (a), (b) fs-TA spectra of ZnSe/CdS/ZnS NCs excited at 400 nm (core excitation) and 600 nm (interfacial state excitation), respectively. (c) Temporal dynamics of the bleaching recovery curves for the ZnSe core (460 nm), CdS shell (500 nm), and interfacial state (625 nm), under the core excitation. Inset: the bandgap alignment of ZnSe and CdS. (d) fs-TA spectra of ZnSe/CdS/ZnS NCs at different delay times. The inset shows time-dependent shifting of interfacial state bleaching toward longer wavelengths, under the 400 nm excitation. (e) Temporal evolution of the spectral position for the interfacial state bleaching.
    Excitation intensity-dependent GSB amplitude of NCs at a 1 ns delay time. The solid line is the theoretical fitting curve produced by Eq. (3).
    Fig. 4. Excitation intensity-dependent GSB amplitude of NCs at a 1 ns delay time. The solid line is the theoretical fitting curve produced by Eq. (3).
    (a) PL spectra of ZnSe/CdS/ZnS NCs excited with various optical intensities at 800 nm. Inset: a double logarithmic plot of the emission integral intensity versus excitation intensity fitting with a slope of 2.1. (b) Open-aperture z-scan curves of pure solvent (toluene) and solution, and the normalized differential transmittance between them (pure NCs). (c) The wavelength dispersion of the 2PA cross section.
    Fig. 5. (a) PL spectra of ZnSe/CdS/ZnS NCs excited with various optical intensities at 800 nm. Inset: a double logarithmic plot of the emission integral intensity versus excitation intensity fitting with a slope of 2.1. (b) Open-aperture z-scan curves of pure solvent (toluene) and solution, and the normalized differential transmittance between them (pure NCs). (c) The wavelength dispersion of the 2PA cross section.
    (a) PL spectra of ZnSe/CdS/ZnS NCs excited with various optical intensities at 1300 nm. Inset: a double logarithmic plot of the emission integral intensity versus excitation intensity fitting with a slope of 3.2. (b) Open-aperture z-scan curves of pure solvent (toluene) and solution, and the normalized differential transmittance between them (pure NCs), excited at the wavelength of 1300 nm. (c) The wavelength dispersion of the 3PA cross section.
    Fig. 6. (a) PL spectra of ZnSe/CdS/ZnS NCs excited with various optical intensities at 1300 nm. Inset: a double logarithmic plot of the emission integral intensity versus excitation intensity fitting with a slope of 3.2. (b) Open-aperture z-scan curves of pure solvent (toluene) and solution, and the normalized differential transmittance between them (pure NCs), excited at the wavelength of 1300 nm. (c) The wavelength dispersion of the 3PA cross section.
    Yang Gao, Xin Qiu, Fuli Zhao, Shuyu Xiao, Junzi Li, Xiaodong Lin, Rui Chen, Tingchao He. Linear and nonlinear photophysical properties of ZnSe/CdS/ZnS core/shell/shell type II nanocrystals[J]. Photonics Research, 2020, 8(9): 1416
    Download Citation