Abstract
In this work, one kind of type II ZnSe/CdS/ZnS core/shell/shell nanocrystals (NCs) is synthesized, and their linear and nonlinear photophysical properties are investigated. Through measurements of the temperature-dependent photoluminescence spectra of NCs, their excitonic properties, including the coefficient of the bandgap change, coupling strength of the exciton acoustic phonons, exciton longitudinal optical (LO) phonons, and LO–phonon energy are revealed. Femtosecond transient absorption spectroscopy was employed to obtain insight into ultrafast processes occurring at the interface of ZnSe and CdS, such as those involving the injection of photo-induced electrons into the CdS shell, interfacial state bleaching, and charge separation time. At the end, their multiphoton absorption spectra were determined by using the z-scan technique, which yielded a maximum two-photon absorption cross section of 3717 GM at 820 nm and three-photon absorption cross section up to at 1220 nm, respectively. The photophysical properties presented here may be important for exploiting their relevant applications in optoelectronic devices and deep-tissue bioimaging.1. INTRODUCTION
Due to their unique optical and optoelectronic properties, semiconductor colloidal nanocrystals (NCs) have very broad application prospects, such as in new solar photovoltaic devices, light-emitting diodes, biological imaging instruments, photodetectors, and nanolasers [1]. Unfortunately, the semiconductor NCs with simple structures usually have many surface defects and serious Auger recombination effects, which will hinder their applications in the fields of optoelectronic devices and biological science.
Up to now, various methods have been proposed to optimize the photophysical properties of semiconductor NCs, among which the most important methods include organic ligand surface modification and shell epitaxial growth. The first method involves passivating surface dangling bonds of NCs with organic ligands [2]. The second method involves epitaxially growing one or multiple shells with a large bandgap outside the core NCs to form a core–shell structure heterojunction, which thus eliminates the surface dangling bonds and effectively reduces the nonradiative recombination caused by surface defects [3]. Compared with the first method, the core–shell heterojunction obtained by the second method shows better compatibility and photothermal stability.
According to the energy values of conduction and valence bands, the core–shell heterojunction can be divided into types I and II [4]. In the type I heterojunction, the electrons and holes are trapped inside the core NCs; in the type II heterojunction, the holes and electrons are confined to the core or shell, respectively. Spatial separation of carriers can greatly reduce the efficiency of Auger recombination [4]. In addition, the type II NCs can emit photoluminescence (PL) with a large Stokes shift and long lifetime, which is advantageous to the application of fluorescence imaging [5–8]. While much progress has been made in understanding the electronic transitions and carrier dynamics of ZnSe/CdS dot-in-rod heterostructures [9], (ZnSe/CdS)/CdS nanorods (NRs) [10], ZnSe/CdS/ZnSe nanobarbells [11], and ZnSe/CdS/Pt NRs [12], the relevant carrier dynamics of ZnSe core epitaxially grown with multiple spherical shells that may be promising for further improvement of their optoelectronic properties has not yet been elucidated. Additionally, the linear and nonlinear photophysical properties of such type II NCs still have not been widely investigated, which is hindering the expansion of their relevant applications.
Sign up for Photonics Research TOC. Get the latest issue of Photonics Research delivered right to you!Sign up now
In this work, we synthesized one kind of type II NCs, i.e., ZnSe/CdS/ZnS core/shell/shell NCs. Their low temperature excitonic properties were revealed through the measurements of temperature-dependent PL spectra. The injection of photo-induced electrons into the CdS shell, interfacial state bleaching, process, as well as charge separation time were studied by femtosecond-transient absorption (fs-TA) spectroscopy. In addition, the z-scan technique was utilized to determine their two- and three-photon absorption (2PA and 3PA) cross sections in the wavelength ranges of 730–870 nm and 1140–1620 nm, respectively.
2. EXPERIMENT
A. Synthesis of ZnSe/CdS/ZnS NCs and Morphology Characterization
The NCs were synthesized according to the procedures reported in Ref. [13]. The NCs’ size distribution was characterized by transmission electron microscopy (TEM, Talos F200X).
B. UV–Vis Absorption and PL Spectra Measurements
The measurements of UV–Vis absorption spectra were carried out by using a UV–Vis spectrophotometer (Lambda 950, PerkinElmer, Inc.), while the PL spectra and absolute PL quantum yield of NCs were recorded on a luminescence spectrophotometer (Zolix, SENS-9000) that was equipped with an intense xenon flash lamp as the excitation source. In all of the above measurements, the concentration of NCs was (1 M = 1 mol/L).
C. PL Lifetime Measurements
The lifetime decay data were collected on an Edinburgh Instruments FLSP920 spectrophotometer by using the time-correlated single-photon counting technique. Picosecond pulses (90 ps, 375 nm) with a repetition rate of 2 MHz were used as the excitation source.
D. Temperature-Dependent PL Spectra
The temperature-dependent PL spectra (10–300 K) measurements were performed within a closed-cycle helium cryostat. During the measurements, 325 nm light from a continuous-wave (CW) He–Cd laser irradiated a close-packed film prepared by drop-casting the NCs solution onto a piece of silicon wafer. The PL signals were dispersed by a monochromator and then detected by a photomultiplier by using a standard lock-in amplifier technique.
E. fs-TA Spectroscopy
Ultrafast carrier dynamics of NCs was investigated by using fs-TA spectroscopy, based on a Ti:sapphire regenerative amplifier system (Spectra-Physics, Inc.) that produces 800 nm pulses with a 100 fs pulse width and 1000 Hz repetition rate. A portion of the 800 nm pulses irradiated onto a sapphire crystal to generate white probe light (360–800 nm). The pump beam was chopped at 100 Hz, and its delay time (0–3 ns) relative to the probe was controlled by using a variable optical delay line. The vertical angle between the pump and probe polarization was set to exclude artificial signals during the measurements. The probe signals were collected with a monochromator/photomultiplier configuration with a lock-in amplifier. All measurements were performed on NCs toluene solutions.
F. Determination of Multiphoton Absorption Cross Sections
The mulitphoton absorption (MPA) cross sections of NCs were determined by using an open-aperture z-scan technique [14], in which the NCs toluene solution was filled into a quartz cell with a 1 mm thickness. In the measurements, the laser pulses (1000 Hz, 100 fs) from an optical parametric amplifier combined with a traveling wave optical parameter amplifier with a tunable wavelength range were used as the excitation source.
3. RESULTS AND DISCUSSION
The TEM image of the ZnSe/CdS/ZnS NCs is presented in Fig. 1(a). The spherical structure can be clearly observed, which thus confirms the epitaxial growth of the anisotropic shell. From the size distribution histogram in Fig. 1(b), the averaged diameter of NCs was estimated as 18.6 nm. The average diameter of original ZnSe core is , while the thickness of the CdS shell is . Their absorption spectrum in Fig. 1(c) shows a resolvable first excitonic transition at 460 nm arising from the ZnSe core, whereas the CdS shell has no resolvable peak. Moreover, there is a low energy tail, which is suggestive of the existence of spatially indirect transitions, due to the type II band alignment. Under 365 nm excitation, the NCs exhibit bright PL emission peaking at 630 nm. Considering staggered band alignment of ZnSe and CdSe NCs, the PL emission can be attributed to indirect type excitonic transition . This assignment can be further supported by the PL excitation (PLE) spectrum that resembles the absorption spectrum of ZnSe/CdS/ZnS NCs [Fig. 1(c)]. The absolute PL quantum yield of the NCs was determined at the level of 7.93%. The ZnS shell further provides an efficient passivation of the surface trap states, giving rise to an efficient PL emission. The PL lifetime of NCs was measured, and the relevant decay curve is depicted in Fig. 1(d); the results showed a double exponential character, with an averaged lifetime of 41 ns. The lifetime value is several orders of magnitude larger than that of organic molecules [15,16] due to the slow electron-hole recombination of the excitons in type II structures.
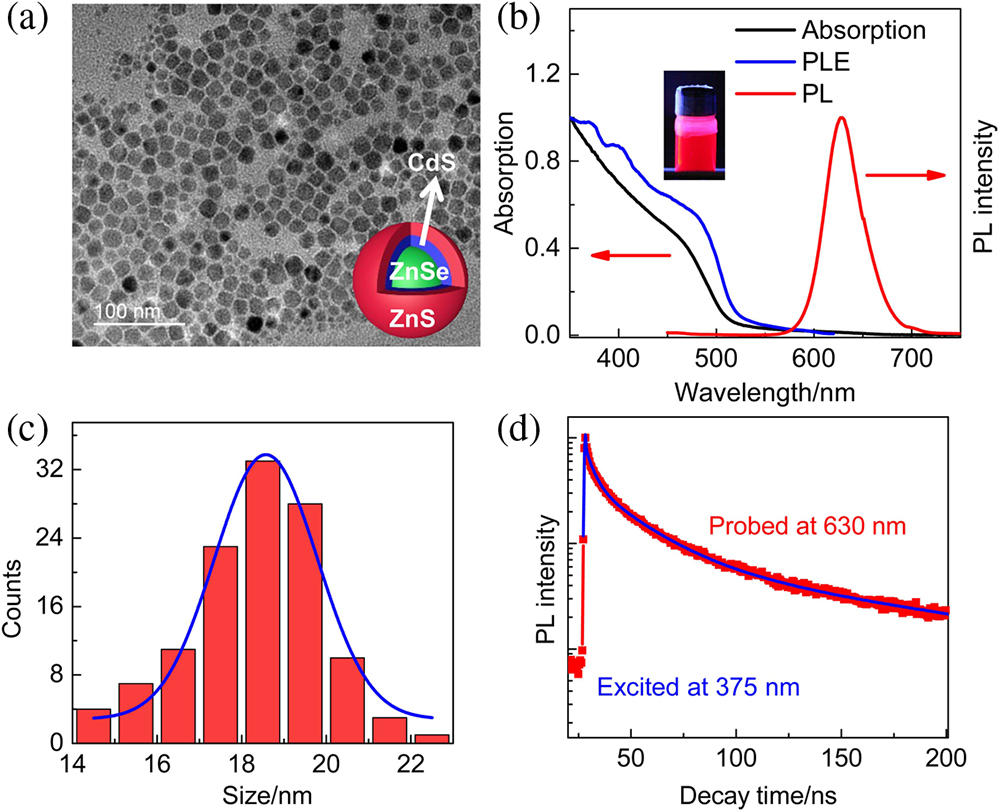
Figure 1.(a) TEM image of ZnSe/CdS/ZnS NCs. Inset: their schematic structure. (b) The absorption, PL (excited at 365 nm), and PLE spectra of NCs. The inset shows their colloidal solutions under UV illumination (). (c) The diameter distribution of the NCs. (d) Time-dependent PL intensity of ZnSe/CdS/ZnS NCs detected at 630 nm.
The temperature-dependent normalized PL spectra of ZnSe/CdS/ZnS NCs under 325 nm excitation are presented in Fig. 2(a). It was found that with the rise in the temperature the PL peak photon energy decreased, while PL full width at half-maximum (FWHM) gradually increased. In addition, the photon energy of NCs at 300 K was redshifted by 54 meV compared with that at 10 K. The thermal shift of the bandgap and the broadening of the PL FWHM were induced by the thermal dilation of the crystal lattice and electron–phonon interactions [17]. To qualitatively characterize the relevant physical parameters during such a process, the NCs’ peak photon energies at different temperatures are plotted in Fig. 2(c), which can be described by the Varshni formula: where and are the bandgap values at temperature and 0 K, respectively, is the coefficient of the bandgap change, and is the Debye temperature for the material [17]. According to the fitting results derived by using Eq. (1), the value of was determined to be 0.00021 eV/K. This value is 1 order of magnitude smaller than that of the ZnSe single crystal (0.00321 eV/K) [17] but comparable to that of cubic NCs () [18].

Figure 2.(a) Temperature-dependent PL mapping of ZnSe/CdS/ZnS NCs under an excitation of 325 nm. The white line indicates a guidance line to the eyes. (b) The comparison of normalized PL spectra of NCs was performed at 10 and 300 K. (c) Temperature-dependent peak energies, where the line is the fitting curve according to Eq. (1). (d) Temperature dependence of the PL FWHM of NCs. The solid line is the fitting according to Eq. (2).
Figure 2(d) shows the temperature dependence of the PL FWHM of the free excitons of the NCs. The thermal broadening of the excitonic peak can be generally interpreted as exciton–phonon interactions. The temperature dependence of the PL FWHM can be approximately described by the following formula: In Eq. (2), is the inhomogeneous peak width at 0 K, while and are homogeneous PL spectrum broadening terms, which result from acoustic and longitudinal optical (LO) phonon scattering, respectively [17]. The coefficients and represent the weights of the exciton–acoustic and LO phonon coupling strengths, respectively. is the phonon energy involved in LO phonon scattering. According to the fitting results based on Eq. (2), the values of , , and were determined as , 10.4 meV, and 19.9 meV, respectively. Again, the value of is 1 order of magnitude smaller than that of ZnSe single crystal (126 meV) [17]. The small values of and in CdSe/CdS/ZnS NCs are indicative of the high PL color purity of NCs at elevated temperature, and the data can be interpreted as the strong quantum confinement of holes into the ZnSe core and lower density of surface defects due to the type II structure and shell passivation effect.
A study on the carrier dynamics of type II heterostructured NCs is vital for their potential application in optoelectronic devices and biological science. Thus, by means of fs-TA spectroscopy, the dynamics of the injection of photo-induced electrons into the CdS shell, interfacial state bleaching, and charge separation time were investigated [9–12,19]. Figure 3(a) describes the delay time-dependent fs-TA spectra of ZnSe/CdS/ZnS NCs, which are excited at 400 nm corresponding to the resonant excitation of the core (ZnSe). The fs-TA spectra in the 0–1 ps time window mainly consisted of one strong bleaching band (i.e., 460 nm) that can be attributed primarily to state filling in the ZnSe, as well as small-amplitude photo-induced bleaching band between 550 and 650 nm.
Figure 3.(a), (b) fs-TA spectra of ZnSe/CdS/ZnS NCs excited at 400 nm (core excitation) and 600 nm (interfacial state excitation), respectively. (c) Temporal dynamics of the bleaching recovery curves for the ZnSe core (460 nm), CdS shell (500 nm), and interfacial state (625 nm), under the core excitation. Inset: the bandgap alignment of ZnSe and CdS. (d) fs-TA spectra of ZnSe/CdS/ZnS NCs at different delay times. The inset shows time-dependent shifting of interfacial state bleaching toward longer wavelengths, under the 400 nm excitation. (e) Temporal evolution of the spectral position for the interfacial state bleaching.
With the increase of delay time, the ZnSe bleaching amplitude decreased accompanied by the appearance of another bleaching band at 500 nm, which was induced by the charge transfer from ZnSe to CdS. Therefore, the bleaching signal at 500 nm should be assigned to the state filling in the CdS. In order to confirm the origin of bleaching band at 550–650 nm, the fs-TA spectra of NCs were recorded under 600 nm, which were dramatically different from those in case of 400 nm excitation. On this condition, the photon energy is smaller than the bandgap values of both ZnSe and CdS. It was found that the bleaching signals of CdS and the band between 550 and 650 nm appeared instantaneously [Fig. 3(b)], indicating that the two transitions share an electron state. Therefore, the bleaching signal at 550–650 nm arose from the 1Sh(ZnSe)–1Se(CdS) interfacial transition, which is thought of as a hole localized in the ZnSe core and an electron in the CdS shell.
Figure 3(c) shows the decay dynamics of the bleaching signals for ZnSe (460 nm), CdS (500 nm), and interfacial state (625 nm). The carriers occupying the ZnSe conduction band at 460 nm decay rapidly, while the bleaching signals for both CdS and interfacial state gradually increase. Considering the bandgap alignment of ZnSe and CdS [inset of Fig. 3(c)], the observed rise in the bleaching signals of CdS can be partly attributed to the relaxation of hot electrons from the higher lying ZnSe conduction band. It can be estimated that the electron injection time into the CdS shell is about 308 fs. In addition, the rise of interfacial state signal () corresponds to the electrons leaving the ZnSe core to become localized in the interfacial state.
Considering the large energy offset in ZnSe and CdS, it should produce an efficient charge separation and thus extensive spectral shift in fs-TA spectra. In order to estimate the spatial separation of charges of NCs, their fs-TA spectra at different delay times were compared [Fig. 3(d)]. It was found that the interfacial state bleaching gradually shifted toward longer wavelength with the increase of delay time, which could be considered as a result for charge separation in the NCs [inset of Fig. 3(d)]. Figure 3(e) shows the temporal evolution of the spectral position for the interfacial state bleaching. By fitting the dynamic curve, the charge separation time in the ZnSe/CdS/ZnS NCs was determined as about 230 ps, which was much longer compared with the (ZnSe/CdS)/CdS heterostructured NRs [10], indicating a more complete charge separation in the former.
Based on the procedures described in previous literature [20,21], the linear absorption cross section () of ZnSe/CdS/ZnS NCs was determined through the measurement of the excited intensity-dependent ground-state bleaching (GSB) signal amplitude at a long delay time (1 ns) (Fig. 4). The solid curve is the best-fitting line based on the following equation: where denotes the GSB signal amplitude of NCs at a 1 ns delay as a function of the excitation intensity, and is the minimum excitation intensity used in the fs-TA experiment [20,21]. The value of was determined as at 350 nm, with a corresponding molar extinction coefficient of .
Figure 4.Excitation intensity-dependent GSB amplitude of NCs at a 1 ns delay time. The solid line is the theoretical fitting curve produced by Eq. (3).
Figure 5(a) shows the PL emission spectra excited with different intensities at the wavelength of 800 nm. It was found that the emission intensity is proportional to the square of the excitation optical intensity, which thus indicates that the 2PA mechanism is involved [22]. The open-aperture z-scan technique was utilized to determine the 2PA cross sections [14]. The z-scan data of pure solvent (toluene) and the NCs solution are presented in Fig. 5(b). The comparison of normalized transmittance of the NCs solution and toluene suggests that the signals of the former contributed by the solvent are much smaller compared with the latter. The wavelength dispersion of the 2PA cross section is presented in Fig. 5(c). It was found that the 2PA peaked at an energy that was higher with respect to the energy for the first one-photon absorption peak, due to the different selection rule between one- and two-photon excitation [23]. The value of the maximum 2PA cross section of ZnSe/CdS/ZnS NCs (3717 GM) was on the same order as that of ZnSe spherical NCs at the wavelength of 806 nm (4900 GM) reported by Lad et al. [24]. It should be noted that Ref. [24] did not investigate the wavelength dispersion of 2PA cross sections. In addition, the epitaxial growth of CdS and ZnS shells onto the ZnSe core not only enhances the photostability but also enlarges the Stokes shift. The abovementioned features are significant for applications in bioimaging application.
Figure 5.(a) PL spectra of ZnSe/CdS/ZnS NCs excited with various optical intensities at 800 nm. Inset: a double logarithmic plot of the emission integral intensity versus excitation intensity fitting with a slope of 2.1. (b) Open-aperture z-scan curves of pure solvent (toluene) and solution, and the normalized differential transmittance between them (pure NCs). (c) The wavelength dispersion of the 2PA cross section.
Compared with two-photon microscopy, the three-photon excitation method can provide a greater penetration depth and higher resolution [25,26]. Encouraged by the large 2PA of ZnSe/CdS/ZnS NCs, the wavelength dispersion of the 3PA cross section was subsequently investigated. Based on the incident power-dependent PL spectra excited at 1300 nm, it was found that the PL intensity varies linearly with the cubic of incident power intensity, which thus demonstrates that 3PA indeed occurs [Fig. 6(a)]. The z-scan technique was also used to determine 3PA cross sections at different wavelengths, with one example at 1300 nm given in Fig. 6(b). From the wavelength dispersion of 3PA cross sections [Fig. 6(c)], it could be seen that the maximum 3PA cross section appeared at 1220 nm, with a relevant value of . The wavelength dependence of the 3PA cross section followed well with the trend of the linear absorption spectrum, which thus indicates that a similar selection rule was involved in the cases of one- and three-photon processes. Interestingly, such a wavelength dispersion of a 3PA cross section has never been revealed in previous literature, and this is of importance for applications in optoelectronic devices and deep-tissue bioimaging.
Figure 6.(a) PL spectra of ZnSe/CdS/ZnS NCs excited with various optical intensities at 1300 nm. Inset: a double logarithmic plot of the emission integral intensity versus excitation intensity fitting with a slope of 3.2. (b) Open-aperture z-scan curves of pure solvent (toluene) and solution, and the normalized differential transmittance between them (pure NCs), excited at the wavelength of 1300 nm. (c) The wavelength dispersion of the 3PA cross section.
4. CONCLUSIONS
In summary, one kind of type II ZnSe/CdS/ZnS core/shell/shell NCs with red PL emission was synthesized, and their linear and nonlinear photophysical properties were comprehensively investigated. Their excitonic properties were revealed through the measurements of temperature-dependent PL spectra. Based on the experimental results derived by using fs-TA spectroscopy, the photo-induced electron injection from core shell, interfacial state bleaching process, as well as charge separation process were investigated. Interestingly, the wavelength dispersion of MPA cross sections of ZnSe/CdS/ZnS NCs has been reported. The good linear and nonlinear photophysical properties demonstrate these are promising materials for various optoelectronic devices and deep-tissue bioimaging.
Acknowledgment
Acknowledgment. X. Q., F. Z., S. X., Z. L., Y. G., and X. L. conducted all of the measurements. R. C. and T. H. supervised the entire work. X. Q. wrote the manuscript. All authors discussed the results and commented on the paper.
References
[1] A. J. Nozik, M. C. Beard, J. M. Luther, M. Law, R. J. Ellingson, J. C. Johnson. Semiconductor quantum dots and quantum dot arrays and applications of multiple exciton generation to third-generation photovoltaic solar cells. Chem. Rev., 110, 6873-6890(2010).
[2] N. Kirkwood, J. O. V. Monchen, R. W. Crisp, G. Grimaldi, H. A. C. Bergstein, I. du Fossé, W. van der Stam, I. Infante, A. J. Houtepen. Finding and fixing traps in II–VI and III–V colloidal quantum dots: the importance of Z-type ligand passivation. J. Am. Chem. Soc., 140, 15712-15723(2018).
[3] L. J. Lauhon, M. S. Gudiksen, D. Wang, C. M. Lieber. Epitaxial core-shell and core-multishell nanowire heterostructures. Nature, 420, 57-61(2002).
[4] S. S. Lo, T. Mirkovic, C. Chuang, C. Burda, G. D. Scholes. Emergent properties resulting from type-II band alignment in semiconductor nanoheterostructures. Adv. Mater., 23, 180-197(2011).
[5] W. Zhang, G. Chen, J. Wang, B. Ye, X. Zhong. Design and synthesis of highly luminescent near-infrared-emitting water-soluble CdTe/CdSe/ZnS core/shell/shell quantum dots. Inorg. Chem., 48, 9723-9731(2009).
[6] H. Wijaya, D. Darwan, K. Rui, G. Lim, T. Wang, K. H. Khoo, Z. Tan. Large-Stokes-shifted infrared-emitting InAs-In(Zn)P-ZnSe-ZnS giant-shell quantum dots by one-pot continuous-injection synthesis. Chem. Mater., 31, 2019-2026(2019).
[7] S. Kim, Y. T. Lim, E. G. Soltesz, A. M. De Grand, J. Lee, A. Nakayama, J. A. Parker, T. Mihaljevic, R. G. Laurence, D. M. Dor, L. H. Cohn, M. G. Bawendi, J. V. Frangioni. Near-infrared fluorescent type II quantum dots for sentinel lymph node mapping. Nat. Biotechnol., 22, 93-97(2004).
[8] B. Blackman, D. Battaglia, X. Peng. Bright and water-soluble near IR-emitting CdSe/CdTe/ZnSe type-II/type-I nanocrystals, tuning the efficiency and stability by growth. Chem. Mater., 20, 4847-4853(2008).
[9] A. N. Grennell, J. K. Utterback, O. M. Pearce, M. B. Wilker, G. Dukovic. Relationships between exciton dissociation and slow recombination within ZnSe/CdS and CdSe/CdS dot-in-rod heterostructures. Nano Lett., 17, 3764-3774(2017).
[10] N. N. Hewa-Kasakarage, M. Kirsanova, A. Nemchinov, N. Schmall, P. Z. El-Khoury, A. N. Tarnovsky, M. Zamkov. Radiative recombination of spatially extended excitons in (ZnSe/CdS)/CdS heterostructured nanorods. J. Am. Chem. Soc., 131, 1328-1334(2009).
[11] N. N. Hewa-Kasakarage, P. Z. El-Khoury, A. N. Tarnovsky, M. Kirsanova, I. Nemitz, A. Nemchinov, M. Zamkov. Ultrafast carrier dynamics in type II ZnSe/CdS/ZnSe nanobarbells. ACS Nano, 4, 1837-1844(2010).
[12] T. O’Connor, M. S. Panov, A. Mereshchenko, A. N. Tarnovsky, R. Lorek, D. Perera, G. Diederich, S. Lambright, P. Moroz, M. Zamkov. The effect of the charge-separating interface on exciton dynamics in photocatalytic colloidal heteronanocrystals. ACS Nano, 6, 8156-8165(2012).
[13] C. M. Tyrakowski, A. Shamirian, C. E. Rowland, H. Shen, A. Das, R. D. Schaller, P. T. Snee. Bright type II quantum dots. Chem. Mater., 27, 7276-7281(2015).
[14] M. Sheik-Bahae, A. A. Said, T.-H. Wei, D. J. Hagan, E. W. Stryland. Sensitive measurement of optical nonlinearities using a single beam. IEEE J. Quantum Electron., 26, 760-769(1990).
[15] N. A. Sayresmith, A. Saminathan, J. K. Sailer, S. M. Patberg, K. Sandor, Y. Krishnan, M. G. Walter. Photostable voltage-sensitive dyes based on simple, solvatofluorochromic, asymmetric thiazolothiazoles. J. Am. Chem. Soc., 141, 18780-18790(2019).
[16] A. K. Mandal, S. Sreejith, T. He, S. K. Maji, X. Wang, S. L. Ong, J. Joseph, H. Sun, Y. Zhao. Three-photon-excited luminescence from unsymmetrical cyanostilbene aggregates: morphology tuning and targeted bioimaging. ACS Nano, 9, 4796-4805(2015).
[17] F. Bogani, L. Carraresi, A. Filoramo, S. Savasta. Exciton-polariton relaxation in ZnSe single crystals. Phys. Rev. B, 46, 9461-9468(1992).
[18] F. Zhao, J. Li, X. Gao, X. Qiu, X. Lin, T. He, R. Chen. Comparison studies of the linear and nonlinear optical properties of CsPbBrxI3−x nanocrystals: the influence of dimensionality and composition. J. Phys. Chem. C, 123, 9538-9543(2019).
[19] C. Chuang, T. L. Doane, S. S. Lo, G. D. Scholes, C. Burda. Measuring electron and hole transfer in core/shell nanoheterostructures. ACS Nano, 5, 6016-6024(2011).
[20] J. Chen, K. Žídek, P. Chábera, D. Liu, P. Cheng, L. Nuuttila, M. J. Al-Marri, H. Lehtivuori, M. E. Messing, K. Han, K. Zheng, T. Pullerits. Size- and wavelength-dependent two-photon absorption cross-section of CsPbBr3 perovskite quantum dots. J. Phys. Chem. Lett., 8, 2316-2321(2017).
[21] T. He, J. Li, X. Qiu, S. Xiao, C. Yin, X. Lin. Highly enhanced normalized-volume multiphoton absorption in CsPbBr3 2D nanoplates. Adv. Opt. Mater., 6, 1800843(2018).
[22] G. S. He, L. Tan, Q. Zheng, P. N. Prasad. Multiphoton absorbing materials: molecular designs, characterizations, and applications. Chem. Rev., 108, 1245-1330(2008).
[23] M. Allione, A. Ballester, H. Li, A. Comin, J. L. Movilla, J. I. Climente, L. Manna, I. Moreels. Two-photon-induced blue shift of core and shell optical transitions in colloidal CdSe/CdS quasi-type II quantum rods. ACS Nano, 7, 2443-2452(2013).
[24] A. D. Lad, P. Prem Kiran, D. More, G. R. Kumar, S. Mahamuni. Two-photon absorption in ZnSe and ZnSe/ZnS core/shell quantum structures. Appl. Phys. Lett., 92, 043126(2008).
[25] C. Ren, X. Deng, W. Hu, J. Li, X. Miao, S. Xiao, H. Liu, Q. Fan, K. Wang, T. He. A near-infrared I emissive dye: toward the application of saturable absorber and multiphoton fluorescence microscopy in the deep-tissue imaging window. Chem. Commun., 55, 5111-5114(2019).
[26] H. Liu, X. Deng, S. Tong, C. He, H. Cheng, Z. Zhuang, M. Gan, J. Li, W. Xie, P. Qiu, K. Wang. In vivo deep-brain structural and hemodynamic multiphoton microscopy enabled by quantum dots. Nano Lett., 19, 5260-5265(2019).

