• Chinese Optics Letters
  • Vol. 21, Issue 12, 123601 (2023)
Cuicui Lu1、*, Wen Zhao1, Sheng Zhang2, Yanji Zheng1, Chenyang Wang3, Yaohua Li3, Yong-Chun Liu3, Xiaoyong Hu4、**, and Zhi Hong Hang2、***
Author Affiliations
  • 1Key Laboratory of Advanced Optoelectronic Quantum Architecture and Measurements of Ministry of Education, Beijing Key Laboratory of Nanophotonics and Ultrafine Optoelectronic Systems, School of Physics, Beijing Institute of Technology, Beijing 100081, China
  • 2School of Physical Science and Technology, Provincial Key Laboratory for Thin Films and Institute for Advanced Study, Soochow University, Suzhou 215006, China
  • 3State Key Laboratory of Low-Dimensional Quantum Physics, Department of Physics, Frontier Science Center for Quantum Information, Tsinghua University, Beijing 100084, China
  • 4State Key Laboratory for Mesoscopic Physics & Department of Physics, Collaborative Innovation Center of Quantum Matter & Frontiers Science Center for Nano-optoelectronics, Beijing Academy of Quantum Information Sciences, Peking University, Beijing 100871, China
  • show less
    DOI: 10.3788/COL202321.123601 Cite this Article Set citation alerts
    Cuicui Lu, Wen Zhao, Sheng Zhang, Yanji Zheng, Chenyang Wang, Yaohua Li, Yong-Chun Liu, Xiaoyong Hu, Zhi Hong Hang. Observation of topological rainbow in non-Hermitian systems[J]. Chinese Optics Letters, 2023, 21(12): 123601 Copy Citation Text show less
    Geometric structure, bulk bands, Zak phase, and the interface states. (a) Non-Hermitian 2D PC structure with square lattices of dielectric column (n = 2.4 + nIi) embedded in the air (n = 1), in which different rows of the dielectric materials have different loss factors nI. a is the lattice constant, and the radius r is 0.27a. (b), (c) Real and imaginary parts of dispersion bands of the 2D PC in TM mode, respectively, and nI is 0.3. The inset is the corresponding unit cell. (d) Calculated values of the Zak phase for the translational lattice at the right of the structure shown in (a), which shows the topological properties of our proposed structure; (e) evolution of the Zak phase for the first bulk band as a function of loss factor nI; (f) dispersion curves of different super unit cells, as shown in the inset. Each color curve corresponds to different loss factors nI.
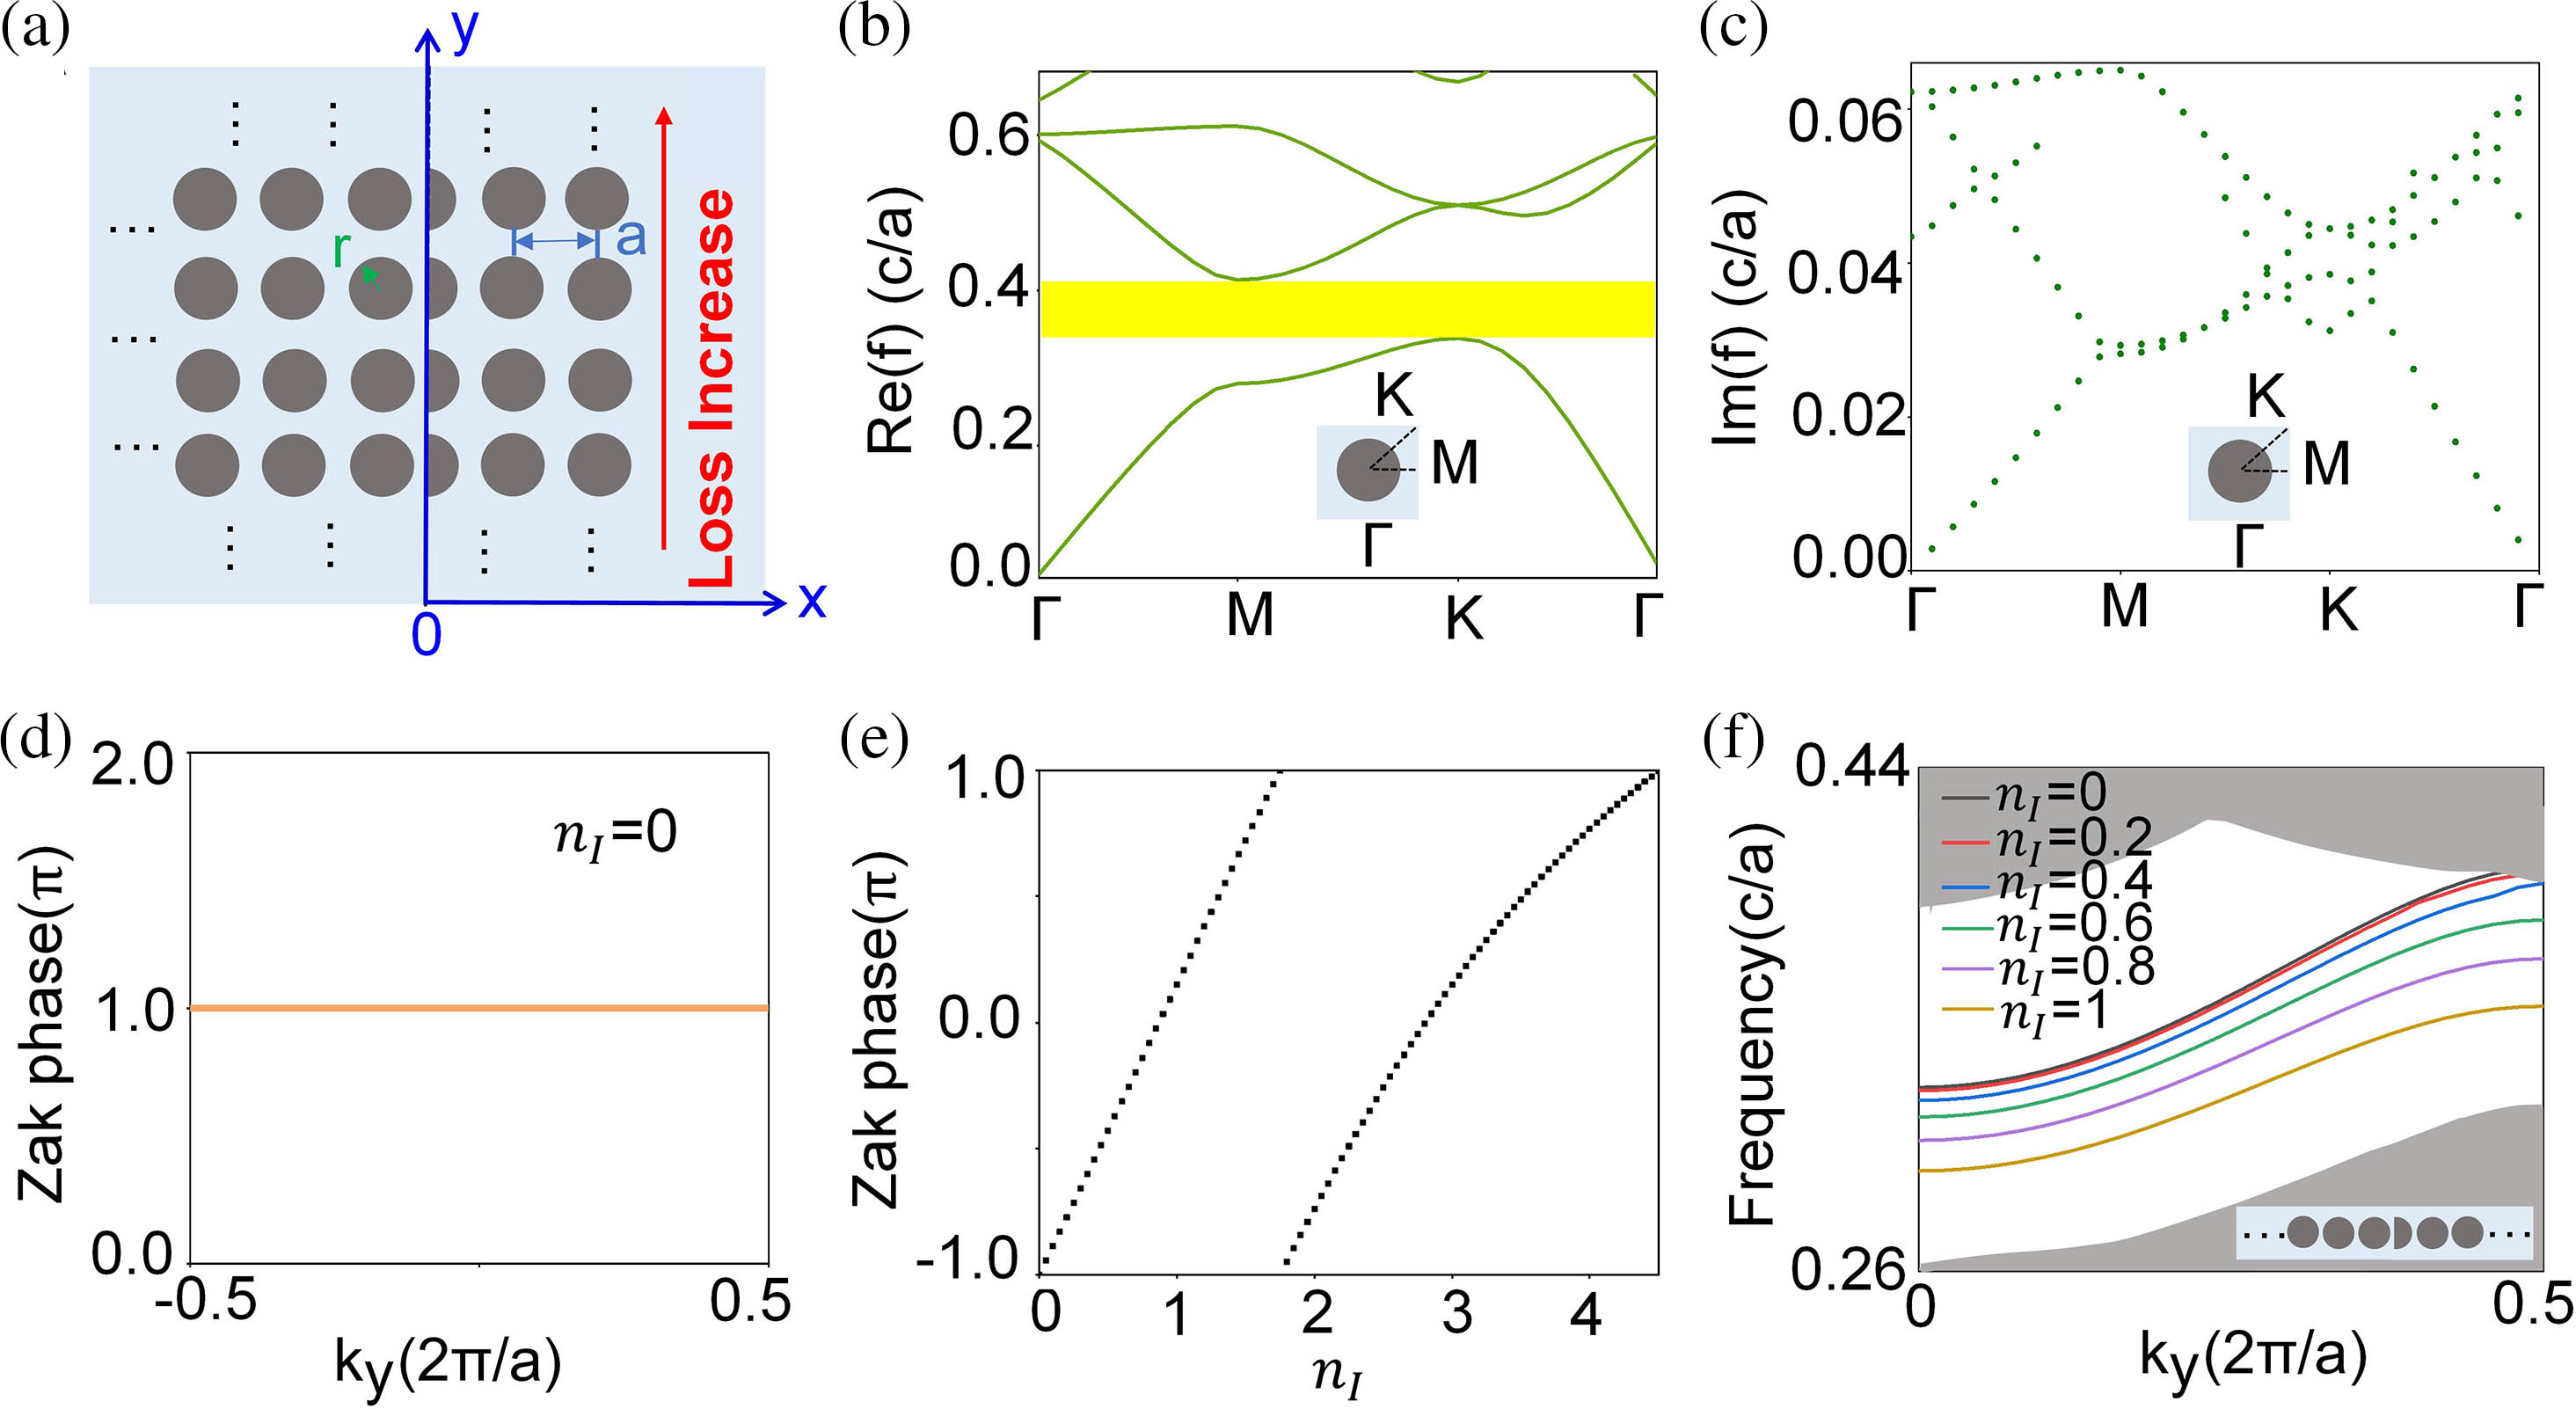
    Fig. 1. Geometric structure, bulk bands, Zak phase, and the interface states. (a) Non-Hermitian 2D PC structure with square lattices of dielectric column (n = 2.4 + nIi) embedded in the air (n = 1), in which different rows of the dielectric materials have different loss factors nI. a is the lattice constant, and the radius r is 0.27a. (b), (c) Real and imaginary parts of dispersion bands of the 2D PC in TM mode, respectively, and nI is 0.3. The inset is the corresponding unit cell. (d) Calculated values of the Zak phase for the translational lattice at the right of the structure shown in (a), which shows the topological properties of our proposed structure; (e) evolution of the Zak phase for the first bulk band as a function of loss factor nI; (f) dispersion curves of different super unit cells, as shown in the inset. Each color curve corresponds to different loss factors nI.
    Non-Hermitian topological rainbow in the interface of two kinds of PCs. (a) Group velocity contour as a function of nI and frequency; (b) magnitude of electric field distributions of all interface states; Y represents the distance of any positions along the y direction, and the fluctuation of the curve shows the magnitude of E. (c) |E| field distribution of the topological rainbow trapping phenomenon of nine topological states shown in (b); (d) Poynting vector power flow |S| distribution of the topological rainbow trapping phenomenon.
    Fig. 2. Non-Hermitian topological rainbow in the interface of two kinds of PCs. (a) Group velocity contour as a function of nI and frequency; (b) magnitude of electric field distributions of all interface states; Y represents the distance of any positions along the y direction, and the fluctuation of the curve shows the magnitude of E. (c) |E| field distribution of the topological rainbow trapping phenomenon of nine topological states shown in (b); (d) Poynting vector power flow |S| distribution of the topological rainbow trapping phenomenon.
    Samples and experimental setup; calculated and measured topological rainbow for square lattices in non-Hermitian systems. (a), (b) Proposed experimental structure consists of a square lattice PC array of wrapped alumina cylinders with a relative permittivity of 7. The thicknesses of lossy materials (sponges, the measured permittivity is 1.1 + 0.4i) for each group increase gradually from bottom to top. (c), (d) Simulated and experimentally measured |E| of topological rainbow in non-Hermitian systems.
    Fig. 3. Samples and experimental setup; calculated and measured topological rainbow for square lattices in non-Hermitian systems. (a), (b) Proposed experimental structure consists of a square lattice PC array of wrapped alumina cylinders with a relative permittivity of 7. The thicknesses of lossy materials (sponges, the measured permittivity is 1.1 + 0.4i) for each group increase gradually from bottom to top. (c), (d) Simulated and experimentally measured |E| of topological rainbow in non-Hermitian systems.
    Robustness of topological rainbow. (a) Schematic of the PC for square lattices with defects; (b) corresponding measured electric field amplitude distributions |E|; the appearance of the topological rainbow has been slightly affected by disorders, which shows the robustness of our structures.
    Fig. 4. Robustness of topological rainbow. (a) Schematic of the PC for square lattices with defects; (b) corresponding measured electric field amplitude distributions |E|; the appearance of the topological rainbow has been slightly affected by disorders, which shows the robustness of our structures.
    Tuning topological rainbow. (a) Calculated electric field |E| distributions with different wrapping thickness of lossy materials at frequency 8.13 GHz; (b) experimentally measured electric field amplitude |E| distributions at frequency 8.13 GHz. Under the different loss distributions, the interface state stops at different spatial positions.
    Fig. 5. Tuning topological rainbow. (a) Calculated electric field |E| distributions with different wrapping thickness of lossy materials at frequency 8.13 GHz; (b) experimentally measured electric field amplitude |E| distributions at frequency 8.13 GHz. Under the different loss distributions, the interface state stops at different spatial positions.
    Cuicui Lu, Wen Zhao, Sheng Zhang, Yanji Zheng, Chenyang Wang, Yaohua Li, Yong-Chun Liu, Xiaoyong Hu, Zhi Hong Hang. Observation of topological rainbow in non-Hermitian systems[J]. Chinese Optics Letters, 2023, 21(12): 123601
    Download Citation