• Spectroscopy and Spectral Analysis
  • Vol. 41, Issue 11, 3424 (2021)
Yang TAN, Qi-gang JIANG*;, Hua-xin LIU, Bin LIU..., Xin GAO and Bo ZHANG|Show fewer author(s)
Author Affiliations
  • College of Geo-exploration Science and Technology, Jilin University, Changchun, 130026, China
  • show less
    DOI: 10.3964/j.issn.1000-0593(2021)11-3424-07 Cite this Article
    Yang TAN, Qi-gang JIANG, Hua-xin LIU, Bin LIU, Xin GAO, Bo ZHANG. Estimation of Organic Matter, Moisture, Total Iron and pH From Back Soil Based on Multi Scales SNV-CWT Transformation[J]. Spectroscopy and Spectral Analysis, 2021, 41(11): 3424 Copy Citation Text show less
    Study area and sampling regions
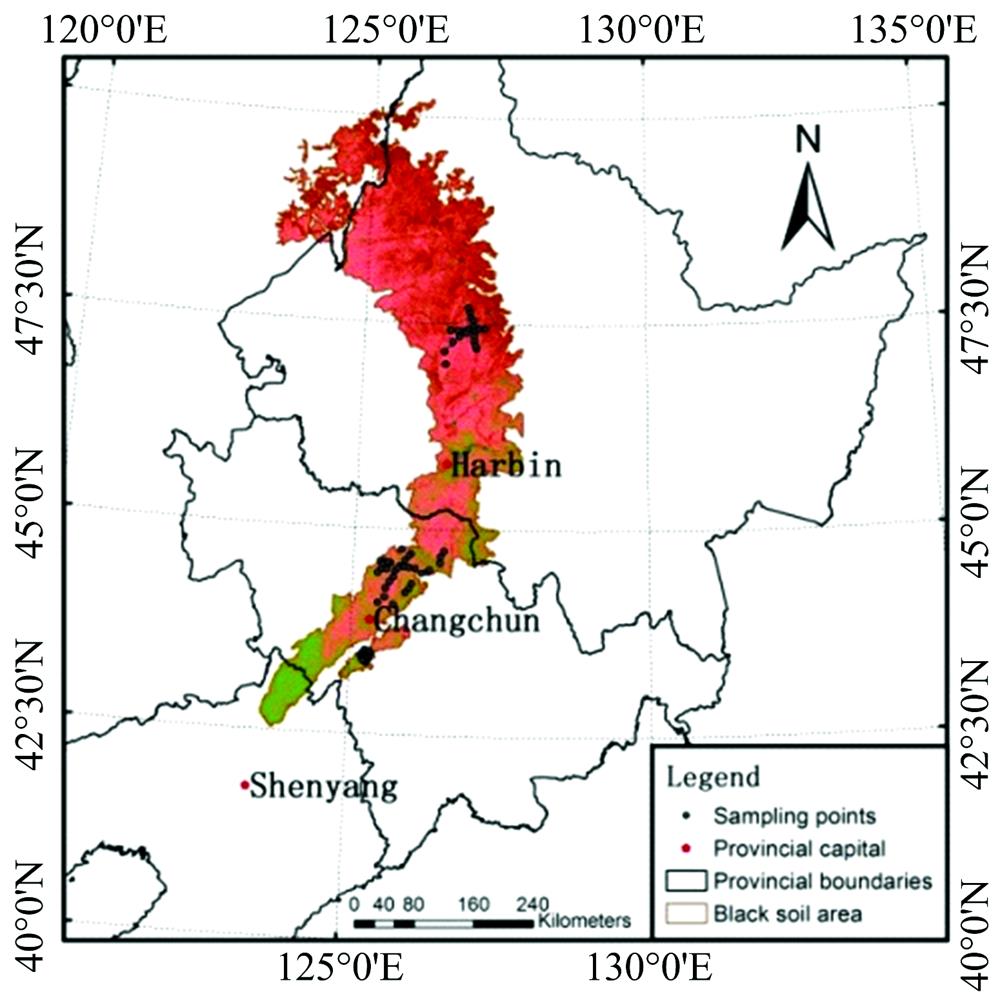
    Fig. 1. Study area and sampling regions
    Reflectance spectraunder different transformation methods
    Fig. 2. Reflectance spectraunder different transformation methods
    Raw reflectance spectra of dry and wet samples
    Fig. 3. Raw reflectance spectra of dry and wet samples
    Coefficients of determination (R2) corresponding to different soil properties on multi SNV-CWT scales
    Fig. 4. Coefficients of determination (R2) corresponding to different soil properties on multi SNV-CWT scales
    Correlations between different soil properties and reflectance before and after SNV-CWT
    Fig. 5. Correlations between different soil properties and reflectance before and after SNV-CWT
    Statistical indicators of models taking bands selected by MBC as input variables
    Fig. 6. Statistical indicators of models taking bands selected by MBC as input variables
    ContentsMaxMinMeanSDCV/%
    SOM/(g·kg-1)63.3619.8734.8612.6536.29
    SMC/(g·kg-1)244.6138.02105.2546.8244.54
    Fe/(g·kg-1)33.6323.0227.162.127.81
    pH8.094.735.740.7713.41
    Table 1. Statistical values of soil component from study area
    ContentsSIRawFDSDCRSNVMSCGSLog(1/R)SNV-CWT
    R20.430.830.700.730.840.680.740.430.90
    SOMMse0.830.250.440.400.230.470.380.830.15
    RPD1.462.511.852.012.711.761.971.373.21
    R2-0.830.870.770.790.740.360.020.93
    SMCMse-3.092.324.283.834.8311.7218.681.37
    RPD-2.793.492.452.342.341.261.134.71
    R2--0.200.170.140.090.27-0.48
    FeMse--0.030.030.030.030.03-0.02
    RPD--1.121.101.111.051.18-1.39
    R2-0.440.360.640.610.280.390.130.62
    pHMse-0.270.320.180.190.360.300.880.19
    RPD-1.381.271.671.601.181.280.951.63
    Table 2. Statistical indicators ofvalidation models of SOM, SMC, Fe and pHunder different transformation methods
    ContentsNTMaxMinR2MseRPD
    SOM30.800.8100.910.123.49
    SMC990.750.9000.911.664.22
    Fe750.110.2200.430.021.34
    pH710.290.4400.650.171.73
    Table 3. Statistical indicators of models taking bands selected by PCC as input variables
    ContentsNTMaxMinR2MseRPD
    SOM20.900.900.680.910.133.32
    SMC890.920.950.740.901.764.02
    Fe800.810.830.740.450.021.38
    pH980.820.850.700.650.171.75
    Table 4. Statistical indicators of models taking bands selected by GRA as input variables
    Yang TAN, Qi-gang JIANG, Hua-xin LIU, Bin LIU, Xin GAO, Bo ZHANG. Estimation of Organic Matter, Moisture, Total Iron and pH From Back Soil Based on Multi Scales SNV-CWT Transformation[J]. Spectroscopy and Spectral Analysis, 2021, 41(11): 3424
    Download Citation