
Zhuyu Ding, Li Fan, Jianjun Chen. Generation of Wide-Bandwidth Polarized Chaotic Signals Based on VCSEL Subject to Dual Chaotic Optical Injection[J]. Acta Optica Sinica, 2019, 39(2): 0214002
- Acta Optica Sinica
- Vol. 39, Issue 2, 0214002 (2019)
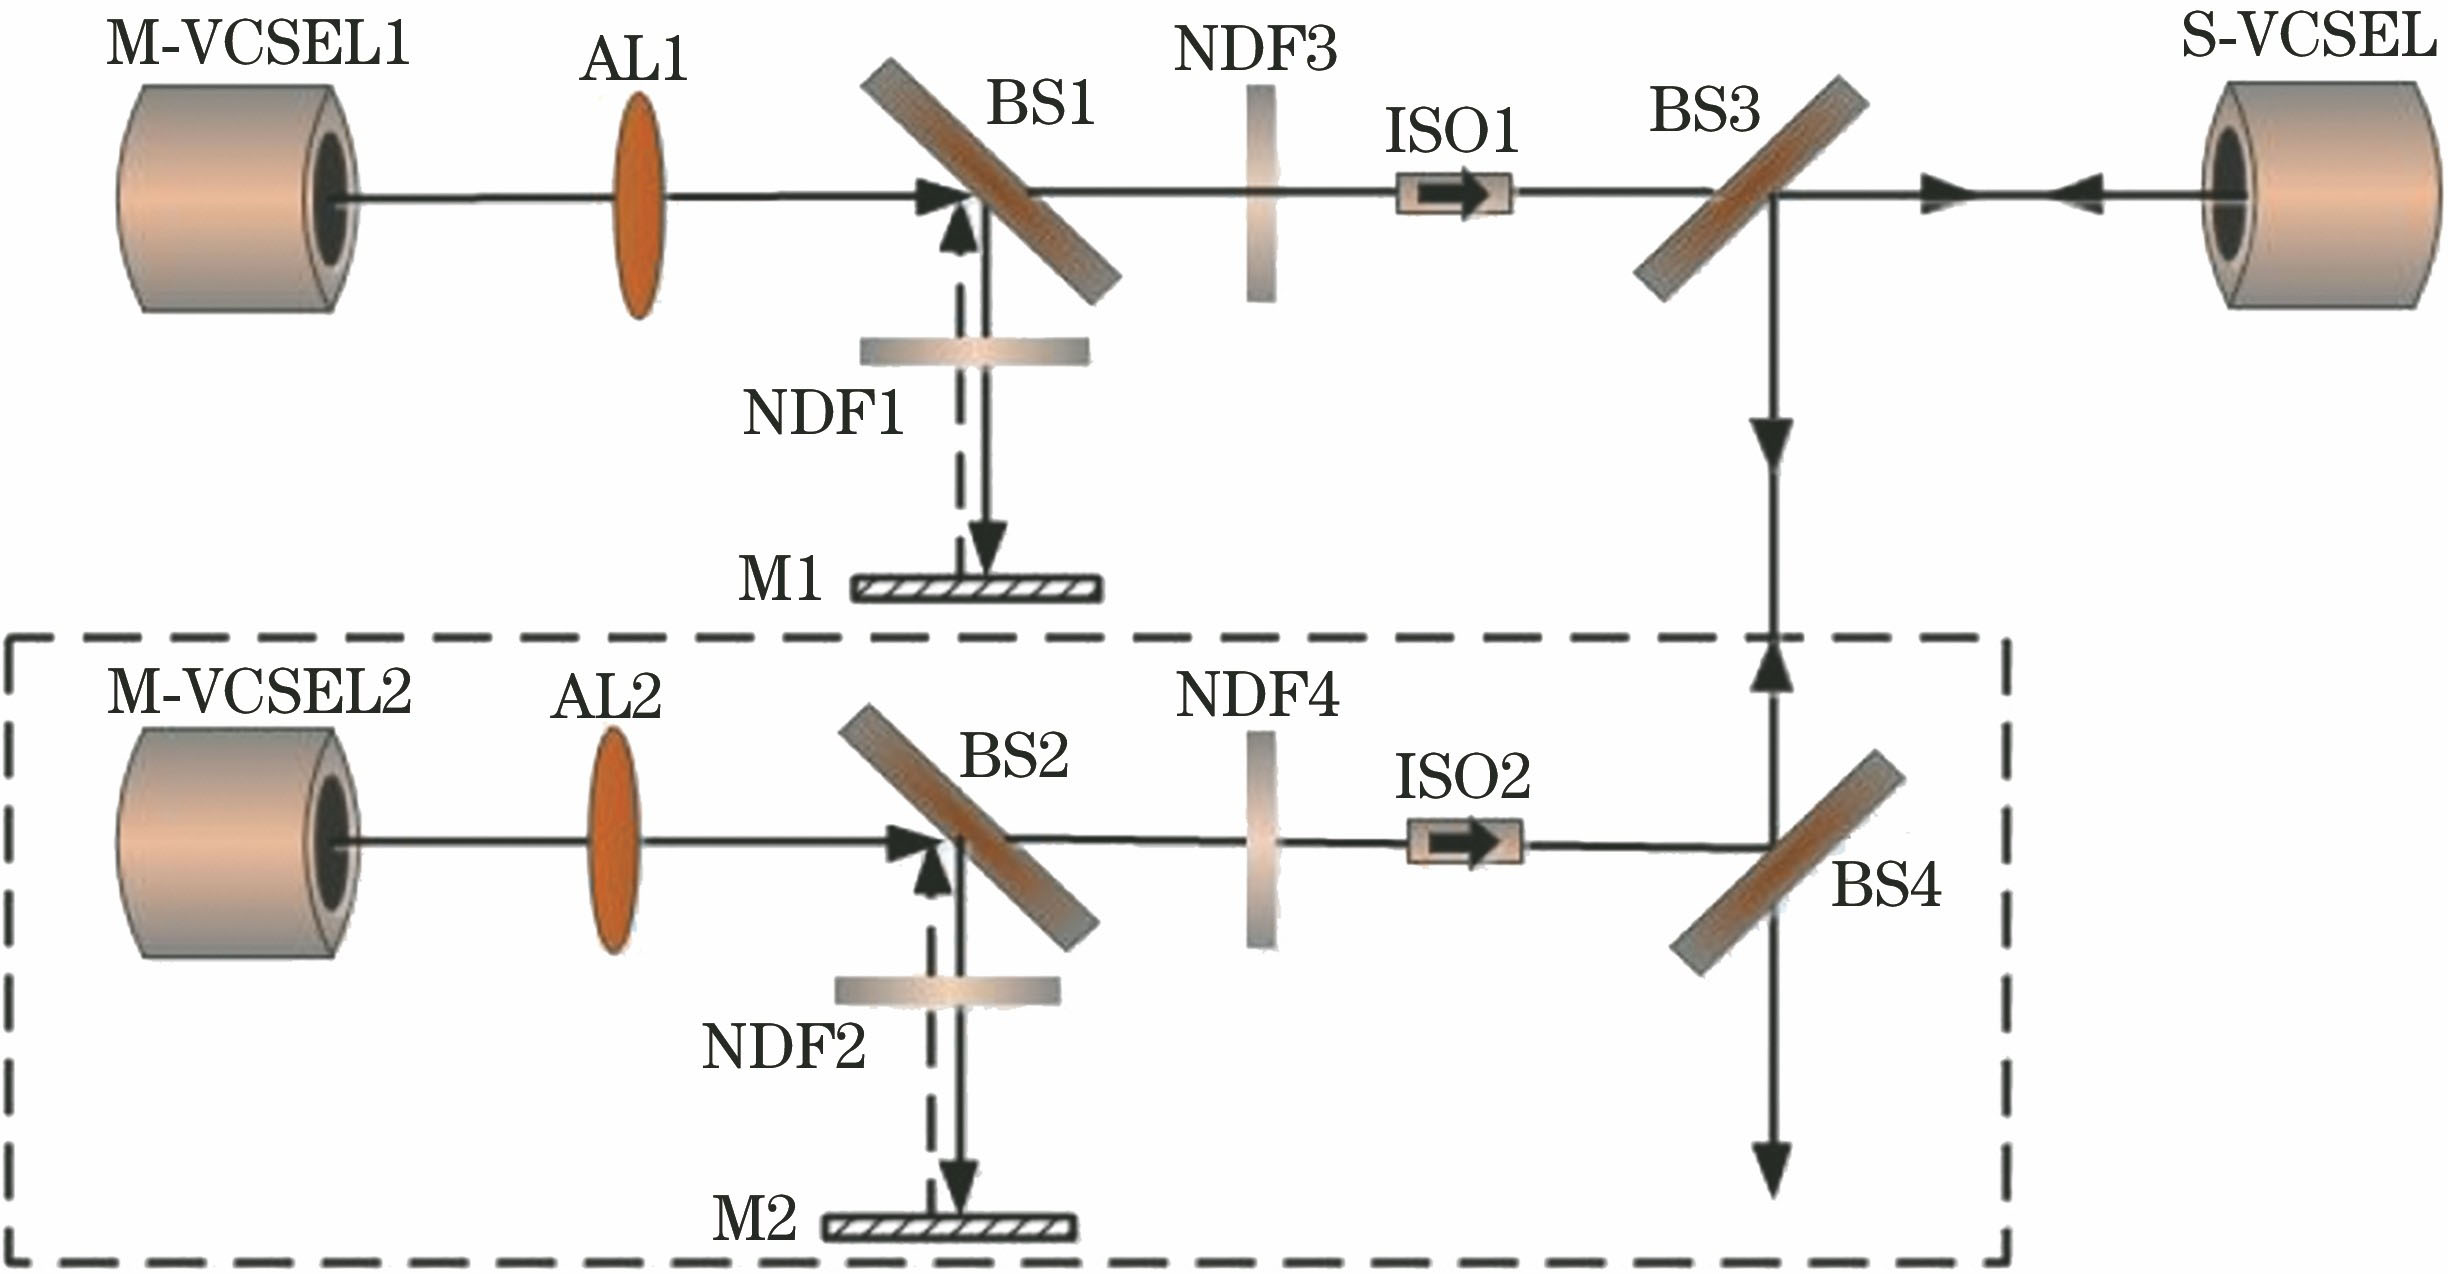
Fig. 1. Schematic of VCSEL system subject to dual chaotic optical injection
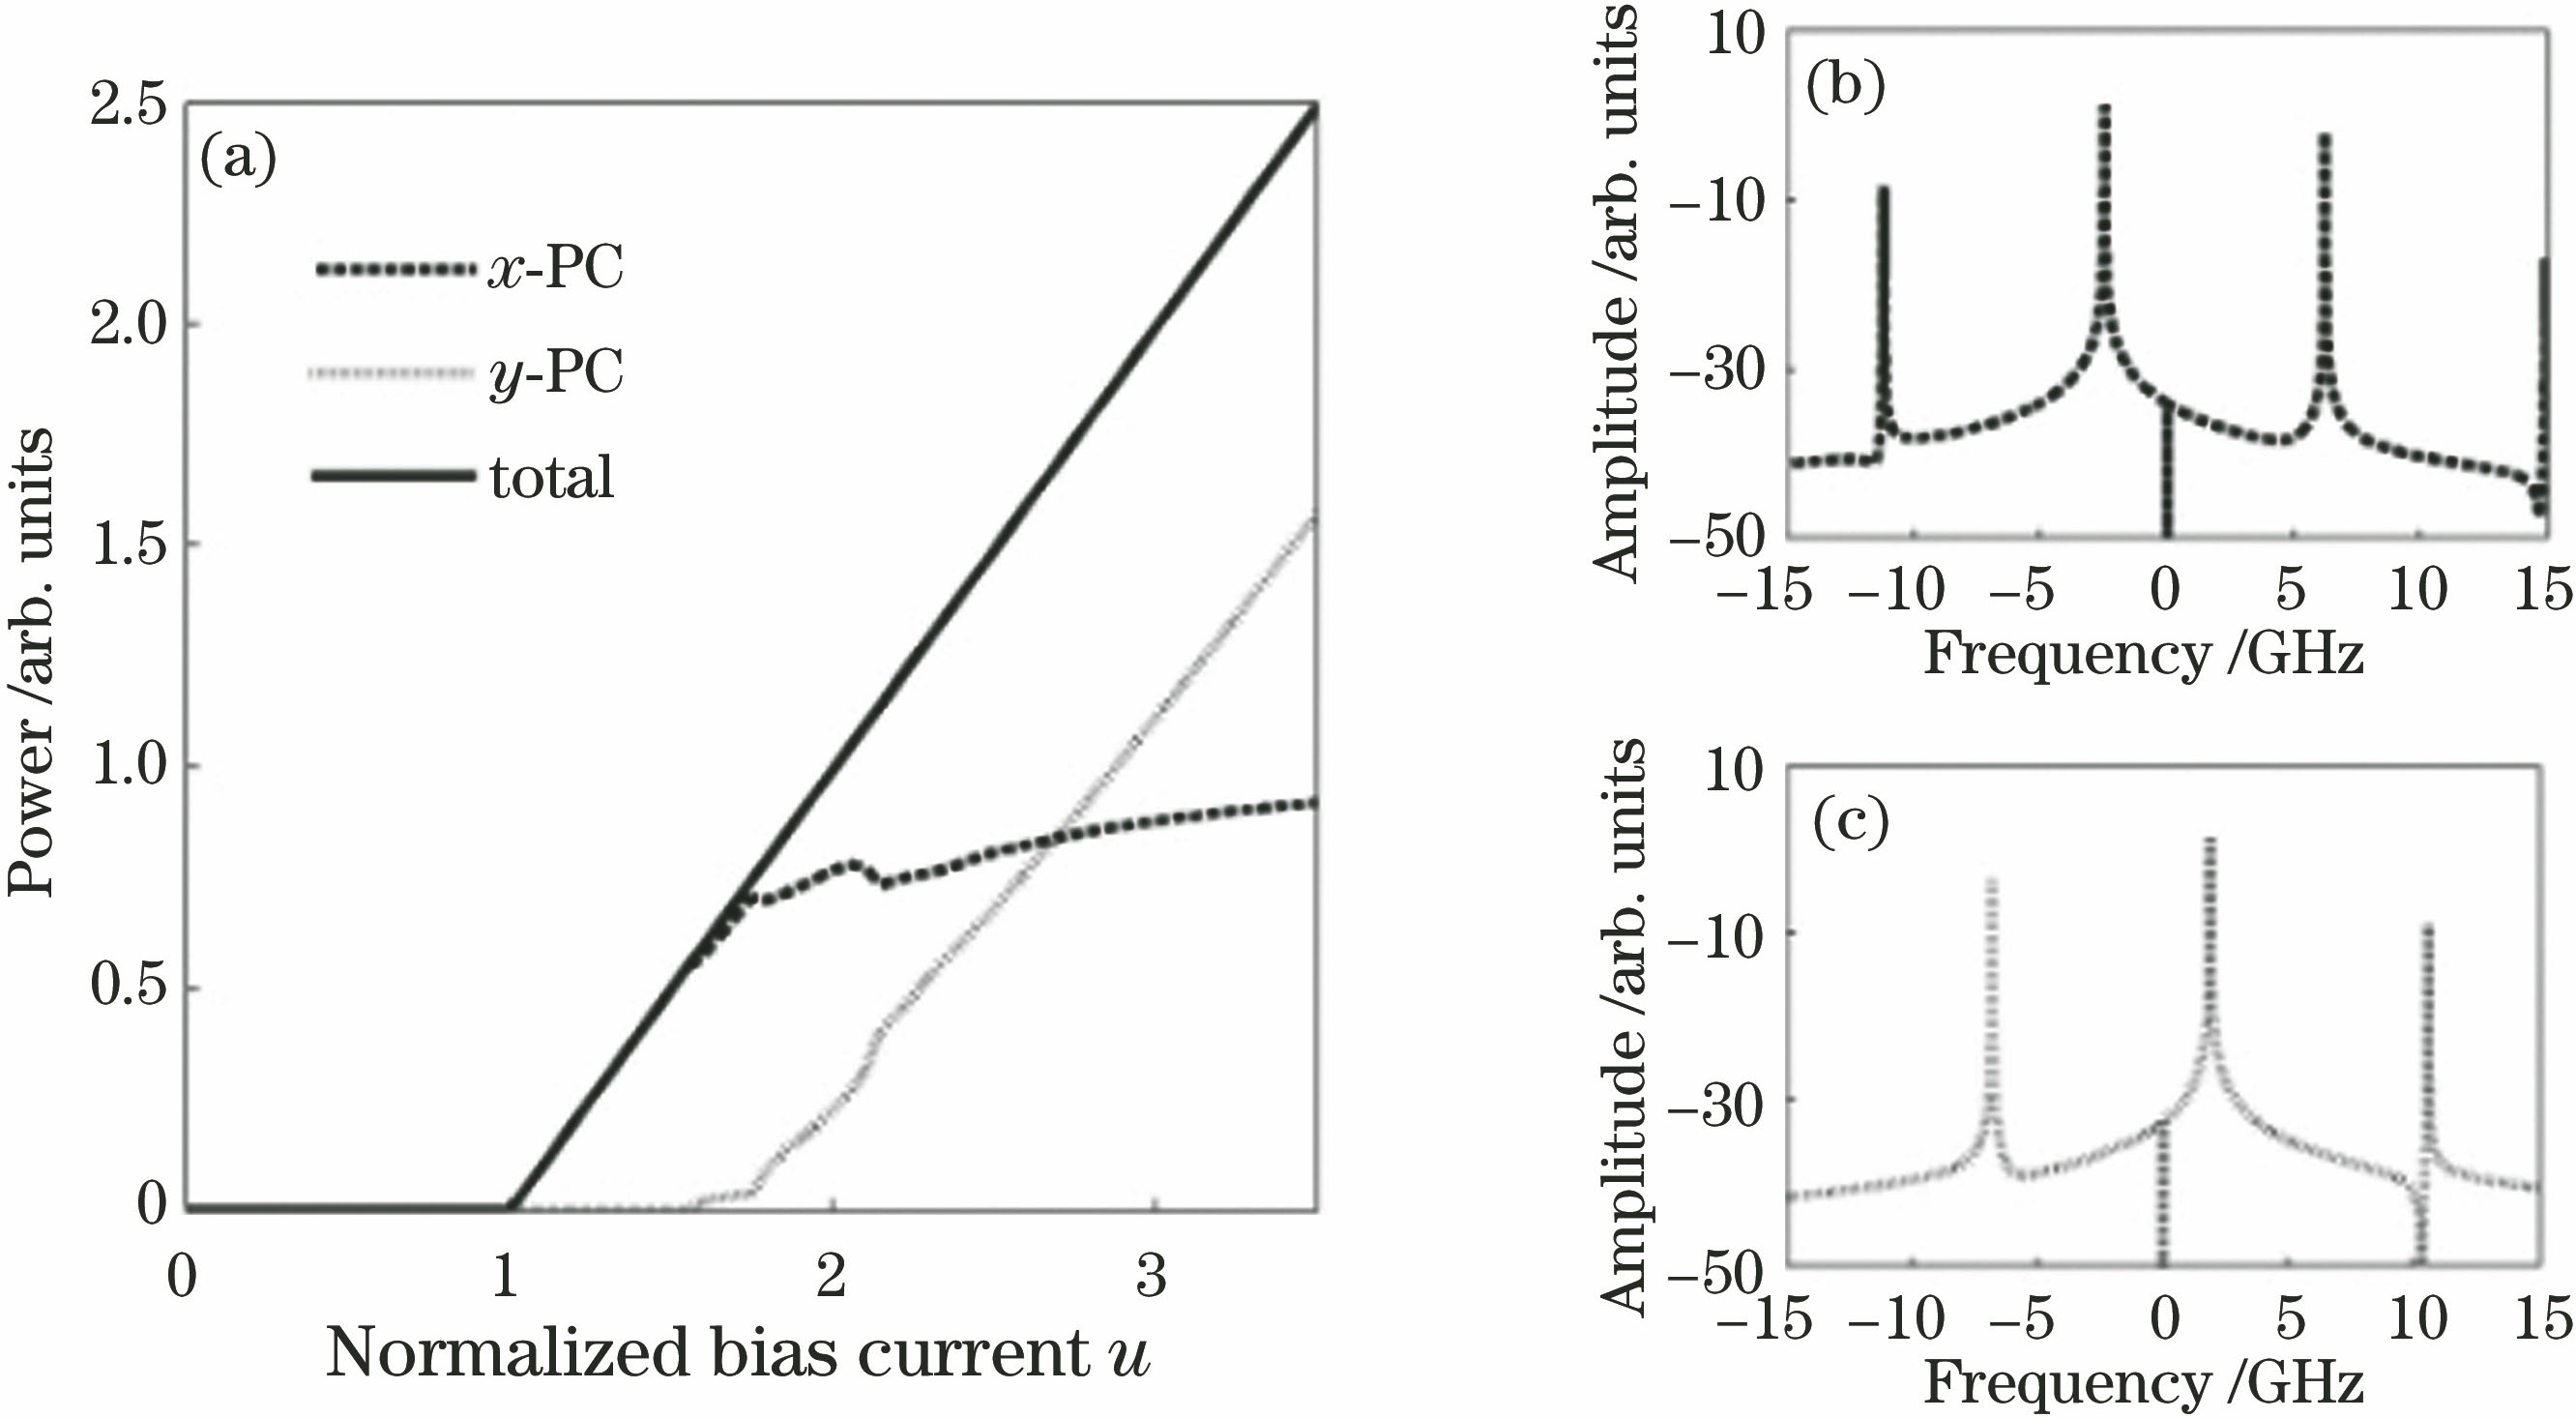
Fig. 2. Polarized output from free-running VCSEL. (a) P-u curves; (b) optical spectrum of x-PC; (c) optical spectrum of y-PC
Fig. 3. Time series and power spectra of X-PC and Y-PC. (a1)-(a4) M-VCSEL1 with optical feedback; (b1)-(b4) S-VCSEL with SCOI under Δv=-20 GHz and ηSCOI= 80 ns-1; (c1)-(c4) S-VCSEL with DCOI under Δv1=Δv2=-20 GHz, ηDCOI=80 ns-1, and η1=η2=40 ns-1
Fig. 4. EBW of polarized output from S-VCSEL versus incident intensity under different frequency detunings. (a) SCOI, x-PC; (b) SCOI, y-PC; (c) DCOI, x-PC; (d) DCOI, y-PC
Fig. 5. Distribution of polarized output from S-VCSEL in parameter space composed of incident intensity and frequency detuning. (a) SCOI, x-PC; (b) SCOI, y-PC; (c) DCOI, x-PC; (d) DCOI, y-PC
Fig. 6. Distribution of EBW of polarized output from S-VCSEL in parameter space composed of frequency detunings Δv1 and Δv2. (a) ηDCOI=40 ns-1, x-PC; (b) ηDCOI=40 ns-1, y-PC
Fig. 7. Distribution of EBW of polarized output from S-VCSEL in parameter space composed of incident intensities η1 and η2. (a) Δv1 =Δv2=-20 GHz, x-PC; (b) Δv1 =Δv2=-20 GHz, y-PC; (c) Δv1 =Δv2=20 GHz, x-PC; (d) Δv1 =Δv2=20 GHz, y-PC

Set citation alerts for the article
Please enter your email address
© Copyright 2018-2021 | Chinese Laser Press. All Rights Reserved 沪ICP备15018463号-20