
Yang WANG, Dan YUE, Xinzhi LI. Genetic Diversity of Toona ciliata Populations based on SSR Markers[J]. Journal of Resources and Ecology, 2020, 11(5): 466
- Journal of Resources and Ecology
- Vol. 11, Issue 5, 466 (2020)
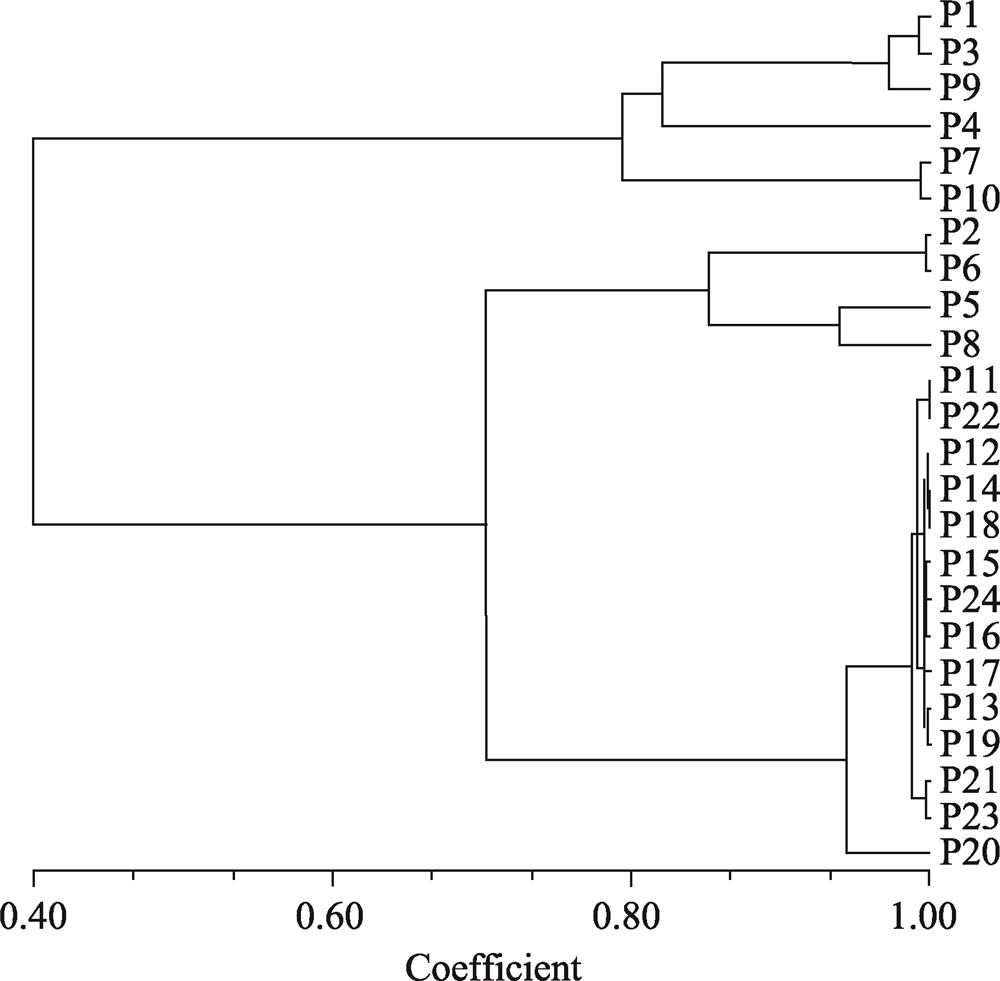
Fig. 1. Fig. 1
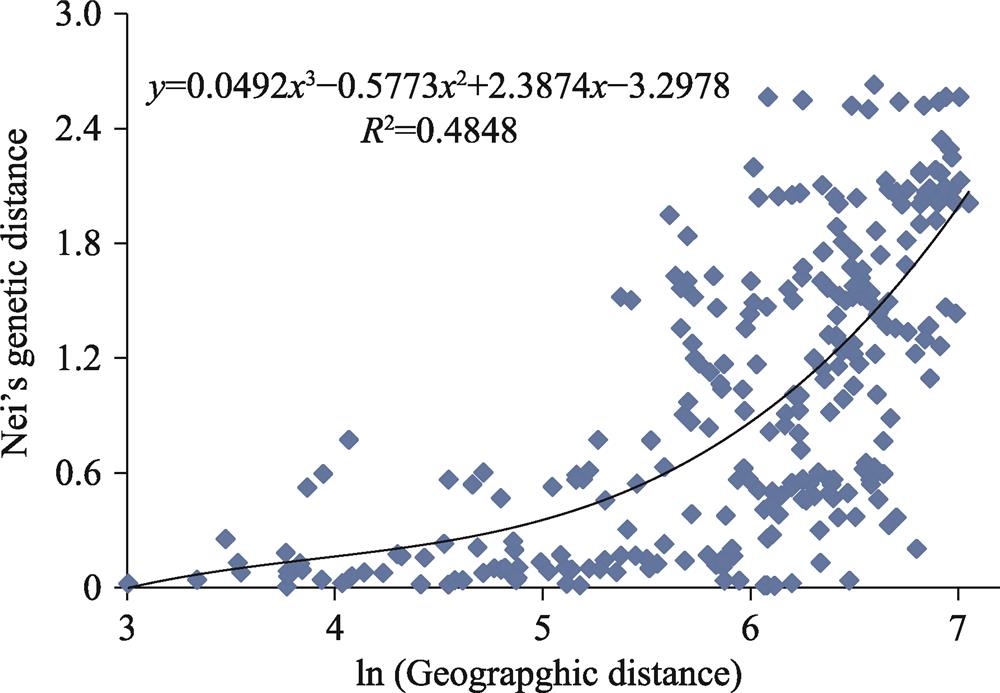
Fig. 2. Fig. 2
|
Table 1.
Locations and altitudes of the 24 sampled populations of Toona ciliata
| ||||||||||||||||||||||||
Table 2.
Primer sequences used in the SSR analysis of T. ciliata
|
Table 3.
Summary of genetic variation statistics of the seven Loci
|
Table 4.
Genetic diversity parameters of 24 T. ciliata populations
|
Table 5.
Coefficients of genetic differentiation and gene flow between T. ciliata populations
|
Table 6.
Geographic distance and Nei’s measures of genetic distance between the different populations

Set citation alerts for the article
Please enter your email address
© Copyright 2018-2021 | Chinese Laser Press. All Rights Reserved 沪ICP备15018463号-20