
Yang WANG, Dan YUE, Xinzhi LI. Genetic Diversity of Toona ciliata Populations based on SSR Markers[J]. Journal of Resources and Ecology, 2020, 11(5): 466
- Journal of Resources and Ecology
- Vol. 11, Issue 5, 466 (2020)
Abstract
1 Introduction
Toona ciliata Roem. is a tall deciduous or semi-evergreen tree, and a precious timber species belonging to genus Toona (Meliaceae). T. ciliata was listed as a wild endangered species under secondary national protection (
So far, studies on T. ciliata at home and abroad have mainly focused on plant physiology and biochemistry, ecology, plant introduction and breeding, and related topics (
Studies of the genetic characteristics of T. ciliata should consider the selection of provenances in different geographical distribution areas and the use of different molecular marker technologies in the investigation and evaluation of T. ciliata resources. We studied 192 germplasm samples from 24 natural T. ciliata populations from five provinces using SSR markers. Through the analyses of genetic diversity, population genetic differentiation, clustering and correlations between geographic distance and genetic distance, we aimed to reveal the genetic diversity level of T. ciliate, and the cause of that diversity, to provide a theoretical basis for the protection and development of T. ciliata germplasm resources.
2 Materials and methods
2.1 Testing materials
In May 2016, experimental samples were collected based on the investigation of 14 naturally-distributed populations of T. ciliata in the provinces of Hubei, Hunan, Jiangxi, Guizhou and Guangxi Zhuang Autonomous Region (
| Population | Location | East | North latitude | Altitude (m) | Population | Location | East | North latitude | Altitude (m) |
|---|---|---|---|---|---|---|---|---|---|
| P1 | Xingyi of Guizhou | 105°02°08 | 24°58°03 | 779 | P13 | Laifeng of Hubei | 109°15°57 | 29°25°58 | 521 |
| P2 | Changde of Hunan | 111°31°08 | 29°18°54 | 399 | P14 | Hefeng of Hubei | 110o12°29 | 30o10°12 | 559 |
| P3 | Ceheng of Guizhou | 105°52°38 | 24°52°16 | 972 | P15 | Enshi of Hubei | 109°14°51 | 30°01°13 | 738 |
| P4 | Tianlin of Guangxi | 106°39°08 | 24°02°12 | 311 | P16 | Xuan’en of Hubei | 109°41°59 | 30o02°26 | 1013 |
| P5 | Shaoyang of Hunan | 111°22°15 | 27°22°30 | 540 | P17 | Lichuan of Hubei | 108°33°49 | 29°51°22 | 521 |
| P6 | Jinggangshan of Jiangxi | 114°09°37 | 26°39°20 | 907 | P18 | Zhushan of Hubei | 110°01°59 | 31°39°58 | 660 |
| P7 | Zhenfeng of Guizhou | 105°46°17 | 25°22°46 | 477 | P19 | Gucheng of Hubei | 111°15°49 | 32°01°36 | 402 |
| P8 | Huaihua of Hunan | 110°05°14 | 27°31°47 | 613 | P20 | Badong of Hubei | 110°23°44 | 30°36°49 | 720 |
| P9 | Anlong of Guizhou | 105°26°25 | 25°06°23 | 1377 | P21 | Chongyang of Hubei | 113°46°25 | 29°26°37 | 338 |
| P10 | Youmai of Guizhou | 105°59°41 | 25°03°19 | 695 | P22 | Tongshan of Hubei | 114°38°39 | 29°24°18 | 567 |
| P11 | Xian°an of Hubei | 114°19°18 | 29°45°42 | 356 | P23 | Huangshi of Hubei | 115°04°51 | 30°11°26 | 356 |
| P12 | Xianfeng of Hubei | 109°00°07 | 29°47°59 | 806 | P24 | Jianshi of Hubei | 110°05°59 | 30°19°26 | 541 |
Table 1.
Locations and altitudes of the 24 sampled populations of Toona ciliata
2.2 Experimental method
2.2.1 DNA extraction
Genomic DNA was extracted from leaflets of T. ciliata using the CTAB method. Purity and quality of extracted DNA were measured with 1.0% agarose gel electrophoresis (AGE), and the DNA concentration was measured with a UV spectrophotometer.
2.2.2 SSR-PCR amplification
Based on the published literatures (
The PCR thermal cycling was: pre-denaturation at 94 ℃ for 5 min, denaturation at 94 ℃ for 45 s, annealing at 55 ℃ for 45 s, with a total of 30 cycles, and extension at 72 ℃ for 45 s. Then, the sequences amplified by PCR were extended at 72 ℃ for 10 min and maintained at 4 ℃ for 5 min. At the end of PCR, the amplified solutions were stored in the refrigerator at 4 ℃ for future use. A total of seven pairs of primers with stable amplification and good repeatability were selected for SSR analysis using the T. ciliata samples. Primer information is shown in
| Primer | Primer combination sequences | |
|---|---|---|
| S5 | F: GTGGCGTAACAGACCAAAAC | R: CCAGAGATACTCCATTCCAG |
| S11 | F: AGTAATAGCCTGTAGAGCAG | R: GAAGAAGGGTGAGCGAGA |
| S22 | F: GAAACCAGCAGGCAGAGC | R: ACCGCATTAGTACCAGTAG |
| T02 | F: TAGGAAAGGCAAGGTGGG | R: GGGTGGTCGATGAGGGTT |
| T05 | F: AGTAATAGCCTGTAGAGCAG | R: AGAGTGGGGTGGTCGATGAG |
| T07 | F: ATGGATGAGTGTGCGATAGG | R: TGTGATGTAGGAGTCTGAAC |
| S422 | F: ATGGATGAGTGTGCGATAGG | R: TGTGATGTAGGAGTCTGAAC |
Table 2.
Primer sequences used in the SSR analysis of T. ciliata
2.3 Data analysis
The amplified banding patterns were recorded as 0 or 1. In the positions with the same mobility rate, each position with a band was denoted as 1, while positions without a band were denoted as 0. DataFormater software (
3 Results and analyses
3.1 Polymorphism of SSR loci
From 29 pairs of SSR primers, seven pairs of markers were obtained which had stable amplification, effective polymorphic information content and uniform genome-wide distribution (
| Locus | PPB (%) | PIC | ||||||
|---|---|---|---|---|---|---|---|---|
| S5 | 2 | 2.1460 | 89.30 | 0.5340 | 0.0000 | 0.4444 | 0.4401 | 0.6603 |
| S11 | 4 | 3.9574 | 75.20 | 0.7473 | 0.0870 | 0.6749 | 0.6675 | 1.2094 |
| S22 | 2 | 1.7950 | 86.63 | 0.4429 | 0.0000 | 0.4266 | 0.4228 | 0.6205 |
| T02 | 2 | 1.4102 | 93.53 | 0.2909 | 0.5965 | 0.4695 | 0.4654 | 0.1447 |
| T07 | 3 | 2.3750 | 63.50 | 0.5789 | 0.0192 | 0.4796 | 0.4750 | 0.8395 |
| T05 | 2 | 2.0880 | 93.70 | 0.5211 | 0.0000 | 0.4708 | 0.4664 | 0.6757 |
| S422 | 4 | 2.0498 | 49.92 | 0.5122 | 0.0357 | 0.5037 | 0.4992 | 0.9745 |
| Mean | 2.7143 | 2.2602 | 78.82 | 0.5182 | 0.1055 | 0.4956 | 0.4909 | 0.7321 |
Table 3.
Summary of genetic variation statistics of the seven Loci
3.2 Genetic diversity of the population
The analyses of the genetic diversity parameters of the 24 populations showed that the number of alleles (Na) varied between 1.0000 and 2.4286, with an average of 1.2629. The number of effective alleles (Ne) ranged from 1.0000 to 2.2286, with an average of 1.2081. The polymorphic in- formation content (PIC) was 0‒100.00%, and the mean was 19.05%. The observed heterozygosity (Ho) was between 0.0000 and 0.2857, with an average of 0.1136. The expected heterozygosity (He) spanned 0.0000 to 0.6190, with a mean of 0.1493, indicating that the diversity level of all populations was lower. Nei’s genetic diversity index (H) was between 0.0000 and 0.5159, with an average of 0.1044. Only P16 had a higher genetic diversity than that of the species level (H = 0.4909) while the other populations with H > 0.1000 were ranked in value as: P16 > P6 > P13 > P15 > P10 > P22 > P8. Shannon information indexes (I) were in the range of 0.0000‒0.8015, with a mean of 0.1546, indicating a low level of genetic diversity (
| Population | PIC | ||||||
|---|---|---|---|---|---|---|---|
| P1 | 1.1429 | 1.1429 | 14.29% | 0.1429 | 0.1429 | 0.0714 | 0.0990 |
| P2 | 1.1429 | 1.1429 | 14.29% | 0.1429 | 0.1429 | 0.0714 | 0.0990 |
| P3 | 1.1429 | 1.1429 | 14.29% | 0.1429 | 0.1429 | 0.0714 | 0.0990 |
| P4 | 1.1429 | 1.1429 | 14.29% | 0.1429 | 0.1429 | 0.0714 | 0.0990 |
| P5 | 1.1429 | 1.1429 | 14.29% | 0.1429 | 0.1429 | 0.0714 | 0.0990 |
| P6 | 2.2857 | 1.8138 | 100.00% | 0.0714 | 0.4481 | 0.4107 | 0.6533 |
| P7 | 1.1429 | 1.1429 | 14.29% | 0.1429 | 0.0952 | 0.0714 | 0.0990 |
| P8 | 1.2857 | 1.1829 | 28.57% | 0.0357 | 0.1310 | 0.1027 | 0.1528 |
| P9 | 1.1667 | 1.1000 | 14.29% | 0.0833 | 0.0714 | 0.0625 | 0.0937 |
| P10 | 1.2857 | 1.2101 | 28.57% | 0.0857 | 0.1302 | 0.1171 | 0.1705 |
| P11 | 1.1429 | 1.1429 | 14.29% | 0.1429 | 0.1429 | 0.0714 | 0.0990 |
| P12 | 1.1429 | 1.1213 | 14.29% | 0.1020 | 0.0706 | 0.0656 | 0.0931 |
| P13 | 1.4286 | 1.2527 | 42.86% | 0.2381 | 0.1810 | 0.1508 | 0.2278 |
| P14 | 1.0000 | 1.0000 | 0.00% | 0.0000 | 0.0000 | 0.0000 | 0.0000 |
| P15 | 1.2857 | 1.2857 | 28.57% | 0.2857 | 0.2857 | 0.1429 | 0.1980 |
| P16 | 2.4286 | 2.2286 | 0.00% | 0.1429 | 0.6190 | 0.5159 | 0.8015 |
| P17 | 1.0000 | 1.0000 | 0.00% | 0.0000 | 0.0000 | 0.0000 | 0.0000 |
| P18 | 1.1429 | 1.1143 | 14.29% | 0.0952 | 0.0762 | 0.0635 | 0.0909 |
| P19 | 1.1429 | 1.1429 | 14.29% | 0.1429 | 0.1429 | 0.0714 | 0.0990 |
| P20 | 1.1429 | 1.1429 | 14.29% | 0.1429 | 0.1429 | 0.0714 | 0.0990 |
| P21 | 1.0000 | 1.0000 | 0.00% | 0.0000 | 0.0000 | 0.0000 | 0.0000 |
| P22 | 1.2857 | 1.1708 | 28.57% | 0.0857 | 0.1175 | 0.1057 | 0.1588 |
| P23 | 1.1429 | 1.0857 | 14.29% | 0.0714 | 0.0714 | 0.0536 | 0.0803 |
| P24 | 1.1429 | 1.1429 | 14.29% | 0.1429 | 0.1429 | 0.0714 | 0.0990 |
| Mean | 1.2629 | 1.2081 | 19.05% | 0.1136 | 0.1493 | 0.1044 | 0.1546 |
Table 4.
Genetic diversity parameters of 24 T. ciliata populations
3.3 Population genetic differentiation
The coefficient of inbreeding (Fis) reveals the deletion or excess of heterozygous genotypes in the total group of samples (
| Locus | |||
|---|---|---|---|
| S5 | 1.0000 | 0.9148 | 0.0233 |
| S11 | -0.1232 | 0.8288 | 0.0516 |
| S22 | 1.0000 | 0.9148 | 0.0233 |
| T02 | -0.7084 | 0.2374 | 0.8029 |
| T07 | 0.7857 | 0.8233 | 0.0537 |
| T05 | 1.0000 | 0.8921 | 0.0302 |
| S422 | 0.6548 | 0.7914 | 0.0659 |
| Mean | -0.0096 | 0.7727 | 0.0735 |
Table 5.
Coefficients of genetic differentiation and gene flow between T. ciliata populations
The genetic differentiation index (Fst) is an important indicator of inter-population genetic differentiation. The mean value of Fst was 0.7727, indicating a high degree of genetic differentiation among the populations. The Fst of T02 (0.2374) was the lowest, but even it reached a high level of genetic differentiation, while the Fst of S5 (0.9148) and S22 (0.9148) were both at the highest value. Gene flow (if Nm > 1) can play a homogenizing role, that is, it can effectively inhibit the differentiation between populations. But when Nm ˂ 1, genetic differentiation between populations definitely occurs (
3.4 Genetic relationship and cluster analysis of the populations
The Mantel test (
| Population | P1 | P2 | P3 | P 4 | P5 | P 6 | P7 | P8 | P9 | P10 | P11 | P12 |
|---|---|---|---|---|---|---|---|---|---|---|---|---|
| P1 | 0.000 | 0.184 | 0.000 | 0.169 | 0.164 | 1.427 | 0.023 | 0.191 | 0.048 | 0.020 | 1.250 | 1.495 |
| P2 | 813.899 | 0.000 | 0.502 | 0.284 | 0.224 | 0.000 | 0.253 | 0.136 | 0.321 | 0.355 | 0.151 | 0.397 |
| P3 | 94.239 | 745.562 | 0.000 | 0.134 | 0.238 | 1.499 | 0.087 | 0.624 | 0.010 | 0.079 | 1.559 | 0.914 |
| P4 | 200.399 | 764.182 | 121.327 | 0.000 | 0.261 | 0.379 | 0.357 | 0.191 | 0.321 | 0.251 | 0.679 | 0.759 |
| P5 | 694.831 | 216.008 | 615.055 | 600.545 | 0.000 | 0.128 | 1.861 | 0.076 | 0.321 | 0.251 | 0.151 | 0.397 |
| P6 | 942.630 | 394.233 | 854.178 | 809.441 | 288.084 | 0.000 | 0.594 | 0.220 | 1.261 | 1.101 | 0.100 | 0.317 |
| P7 | 94.373 | 717.911 | 58.421 | 174.249 | 600.937 | 851.510 | 0.000 | 1.852 | 1.826 | 0.001 | 1.482 | 1.338 |
| P8 | 588.999 | 244.576 | 513.711 | 518.222 | 128.105 | 415.348 | 491.837 | 0.000 | 0.273 | 0.250 | 0.150 | 1.033 |
| P9 | 51.623 | 764.833 | 51.287 | 170.344 | 643.819 | 890.660 | 46.619 | 536.283 | 0.000 | 0.011 | 1.826 | 1.624 |
| P10 | 105.825 | 719.245 | 28.112 | 130.579 | 595.541 | 937.695 | 43.327 | 491.987 | 56.546 | 0.000 | 1.378 | 1.329 |
| P11 | 1102.194 | 295.379 | 1031.610 | 1033.003 | 438.119 | 409.258 | 1006.608 | 518.472 | 1051.834 | 1009.778 | 0.000 | 0.092 |
| P12 | 667.923 | 249.735 | 627.351 | 679.819 | 354.799 | 614.673 | 584.291 | 273.074 | 628.524 | 603.785 | 518.927 | 0.000 |
| P13 | 658.233 | 215.922 | 610.919 | 655.850 | 306.996 | 569.457 | 570.941 | 227.165 | 615.754 | 587.346 | 496.102 | 47.796 |
| P14 | 784.345 | 155.414 | 734.238 | 772.719 | 331.558 | 547.032 | 685.329 | 297.541 | 740.855 | 710.735 | 390.338 | 131.978 |
| P15 | 702.516 | 233.378 | 660.920 | 711.379 | 351.351 | 608.949 | 618.035 | 288.427 | 662.272 | 637.127 | 491.349 | 34.232 |
| P16 | 731.596 | 193.604 | 686.204 | 730.671 | 337.601 | 576.007 | 645.371 | 280.881 | 690.102 | 662.422 | 447.588 | 32.267 |
| P17 | 648.599 | 292.523 | 612.780 | 672.126 | 388.540 | 653.713 | 567.327 | 297.783 | 610.703 | 662.329 | 559.069 | 43.109 |
| P18 | 896.381 | 298.413 | 859.041 | 911.302 | 494.726 | 686.210 | 814.512 | 460.657 | 858.245 | 835.246 | 435.728 | 231.839 |
| P19 | 997.076 | 302.490 | 952.453 | 995.339 | 516.427 | 659.615 | 911.266 | 511.782 | 955.825 | 928.686 | 348.442 | 328.029 |
| P20 | 824.102 | 180.008 | 777.377 | 817.424 | 371.063 | 572.418 | 737.151 | 343.091 | 782.254 | 753.221 | 379.222 | 161.860 |
| P21 | 1004.299 | 222.903 | 932.128 | 926.337 | 329.956 | 305.026 | 910.554 | 418.748 | 955.163 | 910.704 | 117.445 | 467.081 |
| P22 | 1078.720 | 303.619 | 1003.264 | 992.667 | 391.714 | 308.371 | 984.091 | 492.168 | 1028.344 | 982.642 | 108.409 | 548.314 |
| P23 | 1154.471 | 357.847 | 1082.811 | 1077.884 | 477.909 | 401.988 | 1060.605 | 569.301 | 1105.364 | 1061.561 | 73.747 | 588.123 |
| P24 | 789.9930 | 174.5340 | 742.3150 | 783.321 | 351.456 | 409.226 | 702.080 | 314.612 | 747.541 | 718.582 | 399.826 | 129.477 |
| Population | P13 | P14 | P15 | P16 | P17 | P18 | P19 | P20 | P21 | P22 | P23 | P24 |
| P1 | 1.321 | 1.320 | 1.411 | 1.550 | 1.398 | 1.254 | 1.283 | 1.279 | 1.264 | 1.260 | 1.339 | 1.269 |
| P2 | 0.353 | 0.147 | 0.376 | 0.514 | 0.315 | 0.547 | 0.540 | 0.184 | 0.081 | 0.087 | 0.103 | 0.208 |
| P3 | 1.506 | 1.234 | 1.006 | 0.503 | 1.075 | 1.176 | 0.903 | 0.645 | 0.549 | 0.504 | 0.538 | 0.527 |
| P4 | 0.671 | 0.484 | 0.515 | 0.565 | 0.372 | 0.461 | 0.460 | 0.349 | 0.266 | 0.345 | 0.342 | 0.582 |
| P5 | 1.321 | 0.670 | 0.716 | 0.565 | 0.996 | 0.893 | 0.789 | 0.338 | 0.166 | 0.139 | 0.136 | 0.423 |
| P6 | 0.266 | 0.330 | 0.262 | 0.317 | 0.354 | 0.368 | 0.379 | 0.272 | 0.114 | 0.125 | 0.120 | 0.305 |
| P7 | 0.172 | 1.322 | 1.322 | 0.249 | 1.349 | 1.338 | 1.337 | 1.337 | 1.349 | 2.305 | 1.340 | 1.337 |
| P8 | 0.668 | 0.725 | 0.080 | 0.564 | 0.514 | 0.526 | 0.553 | 0.191 | 0.135 | 0.063 | 0.128 | 0.289 |
| P9 | 2.477 | 1.784 | 2.050 | 1.641 | 1.636 | 2.635 | 2.624 | 1.672 | 1.636 | 1.670 | 1.839 | 0.981 |
| P10 | 1.299 | 0.935 | 1.314 | 1.719 | 1.866 | 1.329 | 1.328 | 1.328 | 1.866 | 2.285 | 1.331 | 1.328 |
| P11 | 0.100 | 0.103 | 0.096 | 0.092 | 0.093 | 0.097 | 0.123 | 0.138 | 0.156 | 0.087 | 0.093 | 0.092 |
| P12 | 0.090 | 0.089 | 0.090 | 0.090 | 0.090 | 0.090 | 0.097 | 0.093 | 0.097 | 0.091 | 0.095 | 0.100 |
| P13 | 0.000 | 0.097 | 0.097 | 0.090 | 0.091 | 0.092 | 0.089 | 0.102 | 0.107 | 0.111 | 0.103 | 0.091 |
| P14 | 126.121 | 0.000 | 0.092 | 0.091 | 0.094 | 0.088 | 0.089 | 0.236 | 0.094 | 0.107 | 0.114 | 0.091 |
| P15 | 62.808 | 43.537 | 0.000 | 0.091 | 0.094 | 0.092 | 0.093 | 0.236 | 0.094 | 0.093 | 0.100 | 0.090 |
| P16 | 75.212 | 59.243 | 43.576 | 0.000 | 0.091 | 0.095 | 0.099 | 0.233 | 0.099 | 0.116 | 0.118 | 0.091 |
| P17 | 84.077 | 111.518 | 68.878 | 111.545 | 0.000 | 0.096 | 0.090 | 0.232 | 0.100 | 0.115 | 0.095 | 0.094 |
| P18 | 257.393 | 185.494 | 199.733 | 185.395 | 247.608 | 0.000 | 0.094 | 0.206 | 0.156 | 0.097 | 0.097 | 0.091 |
| P19 | 341.271 | 266.155 | 293.889 | 266.143 | 352.536 | 121.514 | 0.000 | 0.154 | 0.024 | 0.018 | 0.029 | 0.009 |
| P20 | 166.455 | 46.169 | 128.776 | 92.379 | 195.463 | 123.627 | 177.363 | 0.000 | 0.018 | 0.017 | 0.028 | 0.008 |
| P21 | 437.295 | 352.559 | 446.745 | 404.053 | 510.539 | 441.607 | 381.901 | 355.899 | 0.000 | 0.100 | 0.090 | 0.094 |
| P22 | 518.364 | 430.732 | 526.568 | 483.493 | 590.942 | 508.314 | 436.324 | 430.933 | 82.506 | 0.000 | 0.099 | 0.090 |
| P23 | 564.382 | 461.774 | 562.455 | 518.883 | 629.691 | 508.818 | 418.347 | 452.369 | 152.414 | 101.020 | 0.000 | 0.096 |
| P24 | 131.412 | 20.202 | 97.204 | 58.386 | 165.387 | 146.899 | 211.513 | 34.708 | 368.508 | 443.241 | 475.439 | 0.000 |
Table 6.
Geographic distance and Nei’s measures of genetic distance between the different populations
![]()
Figure 1.Fig. 1
![]()
Figure 2.Fig. 2
4 Discussion
4.1 Genetic diversity of T. ciliata
At the species level, Nei’s genetic diversity index (H = 0.4909) was consistent with (but slightly lower than) Shannon diversity index, indicating that the genetic diversity of populations was at a lower level. The level and distribution pattern of genetic diversity of a given plant species are the results of geographical distribution, breeding system, human interferences and many other factors (
T. ciliata is a highly heliophilous species. So, if the plants in the forest cannot reach the canopy, then their competitiveness is insufficient, and the small-and medium-sized plants under the canopy often die (
4.2 Genetic differentiation of populations
The high degree of genetic differentiation indicates that the homologous probability of two gametes being randomly selected from any non-cohabitation populations is low, and, therefore, the homogeneity of genetic composition of the population is also low. The genetic differentiation coefficient (Fst = 0.7727) was higher than that found for T. ciliata var. pubescens (a T. ciliata variety) in central (0.1520) and peripheral populations (0.3045) (
Genetic differentiation is influenced by gene flow, natural selection and mutations (
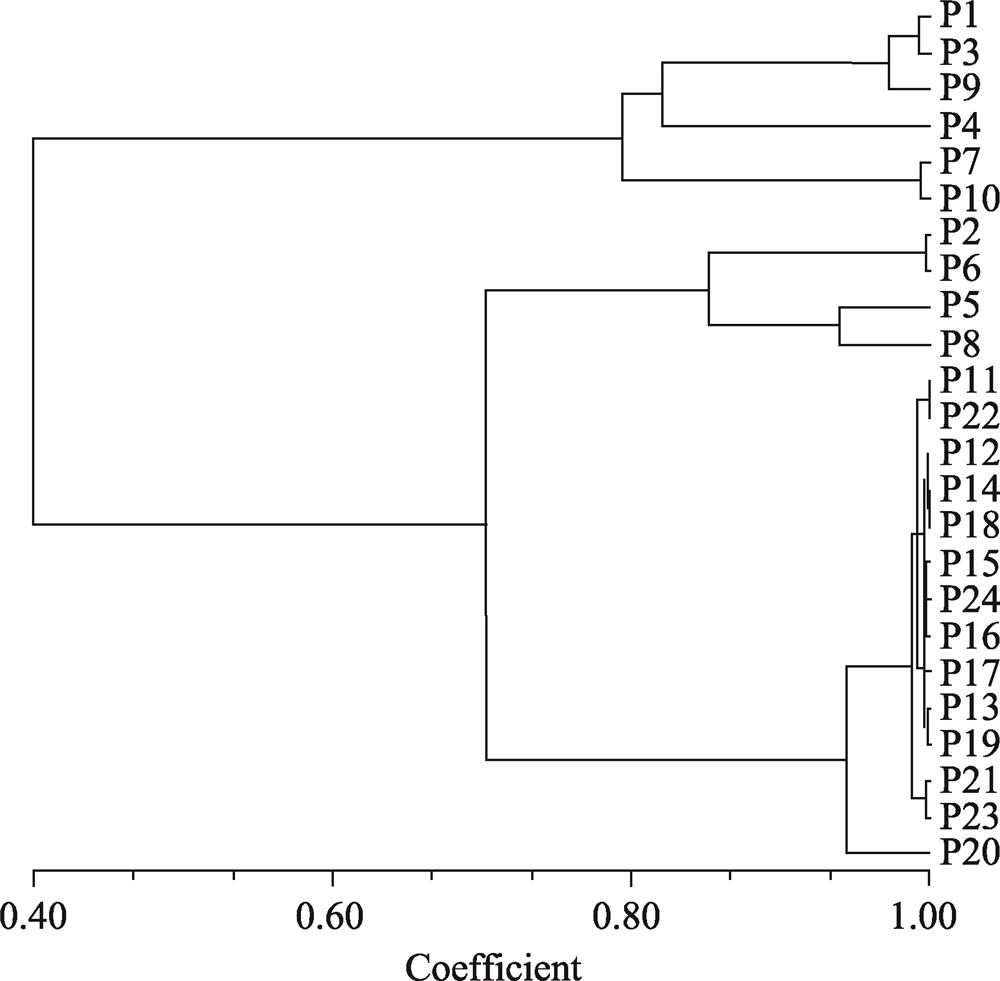
Nei’s genetic distance was significantly related to the geographical distance of the T. ciliata populations. First of all, there were six populations in one group, including P4 of Guangxi Zhuang Autonomous Region as well as P1, P3 P7, P9, and P10 from Guizhou Province. In addition, P2, P5 and P8 from Hunan Province were grouped together, while all 14 populations in Hubei were grouped together. Such a clustering reflected the differences in the geographical distribution areas of T. ciliata (both in the north and in the south), and, as a result, reproduction between the populations was almost completely isolated and the gene flow was greatly blocked.
4.3 Protection and utilization of germplasm resources of T. ciliata
As an important source of genetic diversity, wildlife may possess valuable genetic resources which can serve as the basis for resource utilization. Therefore, systematic research and scientific protection of wildlife should be emphasized (
5 Conclusions
We can generally conclude that the larger distribution area of T. ciliata results in the lower genetic diversity of the species, but the higher genetic diversity at the population level as a whole. The differences in the geographical distribution areas of T. ciliata can add to reproductive isolation. Furthermore, the geographical and environmental characteristics within smaller areas in each group coupled with the resource pressure from human activities have led to the unique clustering pattern. For example, terrain blockage, human interference, and frequent rainfall in the flowering period could bring the reduction of gene exchanges within the populations, resulting in lower genetic diversity within populations. Meanwhile, natural selection and genetic mutations may increase the genetic differentiation.
The key element of germplasm breeding of T. ciliata lies in the selection of families and plants with high genetic diversities within the different populations (
References
[1] Y Cai J, X Chen W, Y Wang et al. Study on variation of fruit and seed phenotypic traits of natural populations of
[2] W Chen L, Q Shi, G Liang et al. Tissue culture of precious timber species
[3] M Duan D, P Chen L, Y Yang X et al. Antidepressant-like effect of essential oil isolated from
[4] J Fan J, L Sheng J, H Li X et al. Analysis on mating system of natural population of
[5] Q Fan W, M Gai H, X Sun et al. DataFormater, a software for SSR data formatting to develop population genetics analysis. Molecular Plant Breeding, 14, 265-270(2016).
[6] L Hamrick J, W Godt M J, L Sherman Broyles S. Gene flow among plant populations: Evidence from genetic markers. In: Peter C H, Stephenson A G(eds.). Experimental and molecular approaches to plant biosystematics, 215-232(1995).
[7] W Huang G, C Peng, L Chen H et al. Comparison of the growth and photosynthetic characteristics of
[8] P Lesica, W Allendorf F. When are peripheral populations valuable for conservation?. Conservation Biology, 9, 753-760(1995).
[9] P Li, M Que Q, X Ouyang K et al. Genetic diversity of
[10] D Liu, B Liu, M Zeng Q et al. Genetic diversity of the superior genotypes of
[11] J Liu, T Chen Y, M Jiang J et al. Study on population genetic structure in
[12] J Liu, M Jiang J, J Zou et al. Genetic diversity of central and peripheral populations of
[13] J Liu, X Sun Z, T Chen Y et al. Isolation of microsatellite DNA from endangered tree
[14] L Long H, Y Feng, Q Xiang et al. A study of the growth characteristics of
[15] P Malairajan, G Gopalakrishnan, S Narasimhan et al. Anti-ulcer activity of crude alcoholic extract of
[18] Y Miao Z, Y Yang, F Liu P et al. Analysis of red leaf color SSR molecular markers by transcriptome sequencing of
[21] W Powell, M Morgante, C Andre et al. The comparison of RFLP, RAPD, AFLP and SSR (microsatellite) markers for germplasm analysis. Molecular Breeding, 2, 225-238(1996).
[22] A Schaal B, A Hayworth D, M Olsen K. Phylogeographic studies in plants: Problems and prospects. Molecular Ecology, 7, 465-475(1998).
[23] M Slatkin. Estimating levels of gene flow in natural populations. Genetics, 99, 323-335(1981).
[24] W Wang R, W Huang G, L Chen H et al. Seed germination rate and seedling characteristics of
[25] Y Wang, X Chen W, J Ming A et al. Study on variation of leaflet phenotypic traits of natural populations of
[26] Y Wang, Z Leng Y, J Su C et al. Spatial structure and distribution pattern of natural. Toona ciliata populations in the Enshi Region. Journal of Zhejiang A & F University, 33, 17-25(2016).
[27] Y Wang, F Min S, B Jiang X et al. Selection criteria for superior
[28] Y Wang, E Tian Y, Y Gan X et al. Geographic trend surface analysis of phenotypic variance of
[29] Y Wang, X Yan K, X Teng J et al. Analysis on natural population dynamics of endangered species
[30] Y Wang, J Zhu S, J Li et al. Species abundance distribution patterns of a
[31] H Wen W, Y Wu J, G Chen M et al. Seedling growth performance of
[32] S Wright. The genetic structure of populations. Annals of Engenics, 15, 323-354(1951).
[33] T Wu, Y Chen S, N Ning D et al. Genetic diversity of walnut germplasm in Nujiang prefecture based on SSR. Journal of Fujian Agriculture and Forestry University (Natural Science Edition), 48, 252-258(2019).
[34] B Yang H, R Zhang, S Wang B et al. Analysis of genetic diversity in
[35] M Yi G, H Li J, M Wang D et al. SSR distribution characteristic analysis and molecular marker development. Acta Horticulturae Sinica, 40, 571-578(2013).
[36] G Yi X, J Chen, X You L et al. Genetic diversity of
[37] F Yu Y. The milestone of China wild plants protection. Plants, 3-11(1999).
[38] X Zhan, J Lu H, S Zhao et al. Establishment and primer screening of SSR-PCR reaction system for. Toona ciliata. Forest Research, 29, 565-570(2016).
[39] L Zhang M, Q Li M. Optimization of SSR-PCR reaction system on an endangered plant

Set citation alerts for the article
Please enter your email address
© Copyright 2018-2021 | Chinese Laser Press. All Rights Reserved 沪ICP备15018463号-20