
Li Zhang, Danping Huang, Shipeng Liao, Shaodong Yu, Jianqiu Ye, Xin Wang, Na Dong. Wheelset Tread Defect Detection Method Based on Target Detection Network[J]. Laser & Optoelectronics Progress, 2021, 58(4): 0410020
- Laser & Optoelectronics Progress
- Vol. 58, Issue 4, 0410020 (2021)
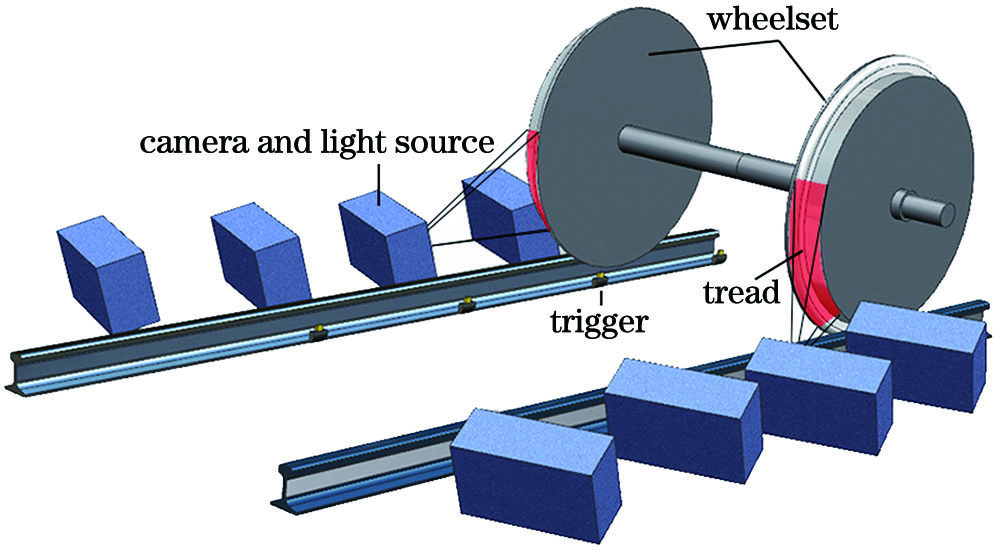
Fig. 1. Schematic of collection equipment

Fig. 2. Collected wheelset images
Fig. 3. Flow chart of dual network detection algorithm
Fig. 4. Areas with contrasting gray values
Fig. 5. Direction-corrected wheelset images
Fig. 6. SSD network structure
Fig. 7. YOLOv3 network structure
Fig. 8. Distribution chart between original Anchor Boxes and target size
Fig. 9. M-YOLOv3 network structure
Fig. 10. Distribution chart between new Anchor Boxes and target size
Fig. 11. P-R curves of three models when extracting tread
Fig. 12. Partial identification renderings of the three networks. (a) SSD300; (b) YOLOv3; (c) YOLOv3-tiny
Fig. 13. P-R curves of five models when identifying defects
Fig. 14. Partial identification renderings of five kinds of networks. (a) M-YOLOv3; (b) YOLOv3; (c) YOLOv3-tiny; (d) SSD300; (e) SSD512
Fig. 15. Missing and misdetection of some tread defects
Fig. 16. P-R curve of two detection methods
|
Table 1. Tread detection performance
|
Table 2. Defect detection performance
|
Table 3. Defect detection performance of two detection methods

Set citation alerts for the article
Please enter your email address
© Copyright 2018-2021 | Chinese Laser Press. All Rights Reserved 沪ICP备15018463号-20