
Min Yang, Zhaoyan Liu, Yongguang Zhao, Lingling Ma, Wan Li, Ning Wang, Chuanrong Li, Lingli Tang. On-Orbit Radiometric Calibration Method for Satellites Based on TOA Reflectance at Baotou Site[J]. Acta Optica Sinica, 2021, 41(18): 1828001
- Acta Optica Sinica
- Vol. 41, Issue 18, 1828001 (2021)
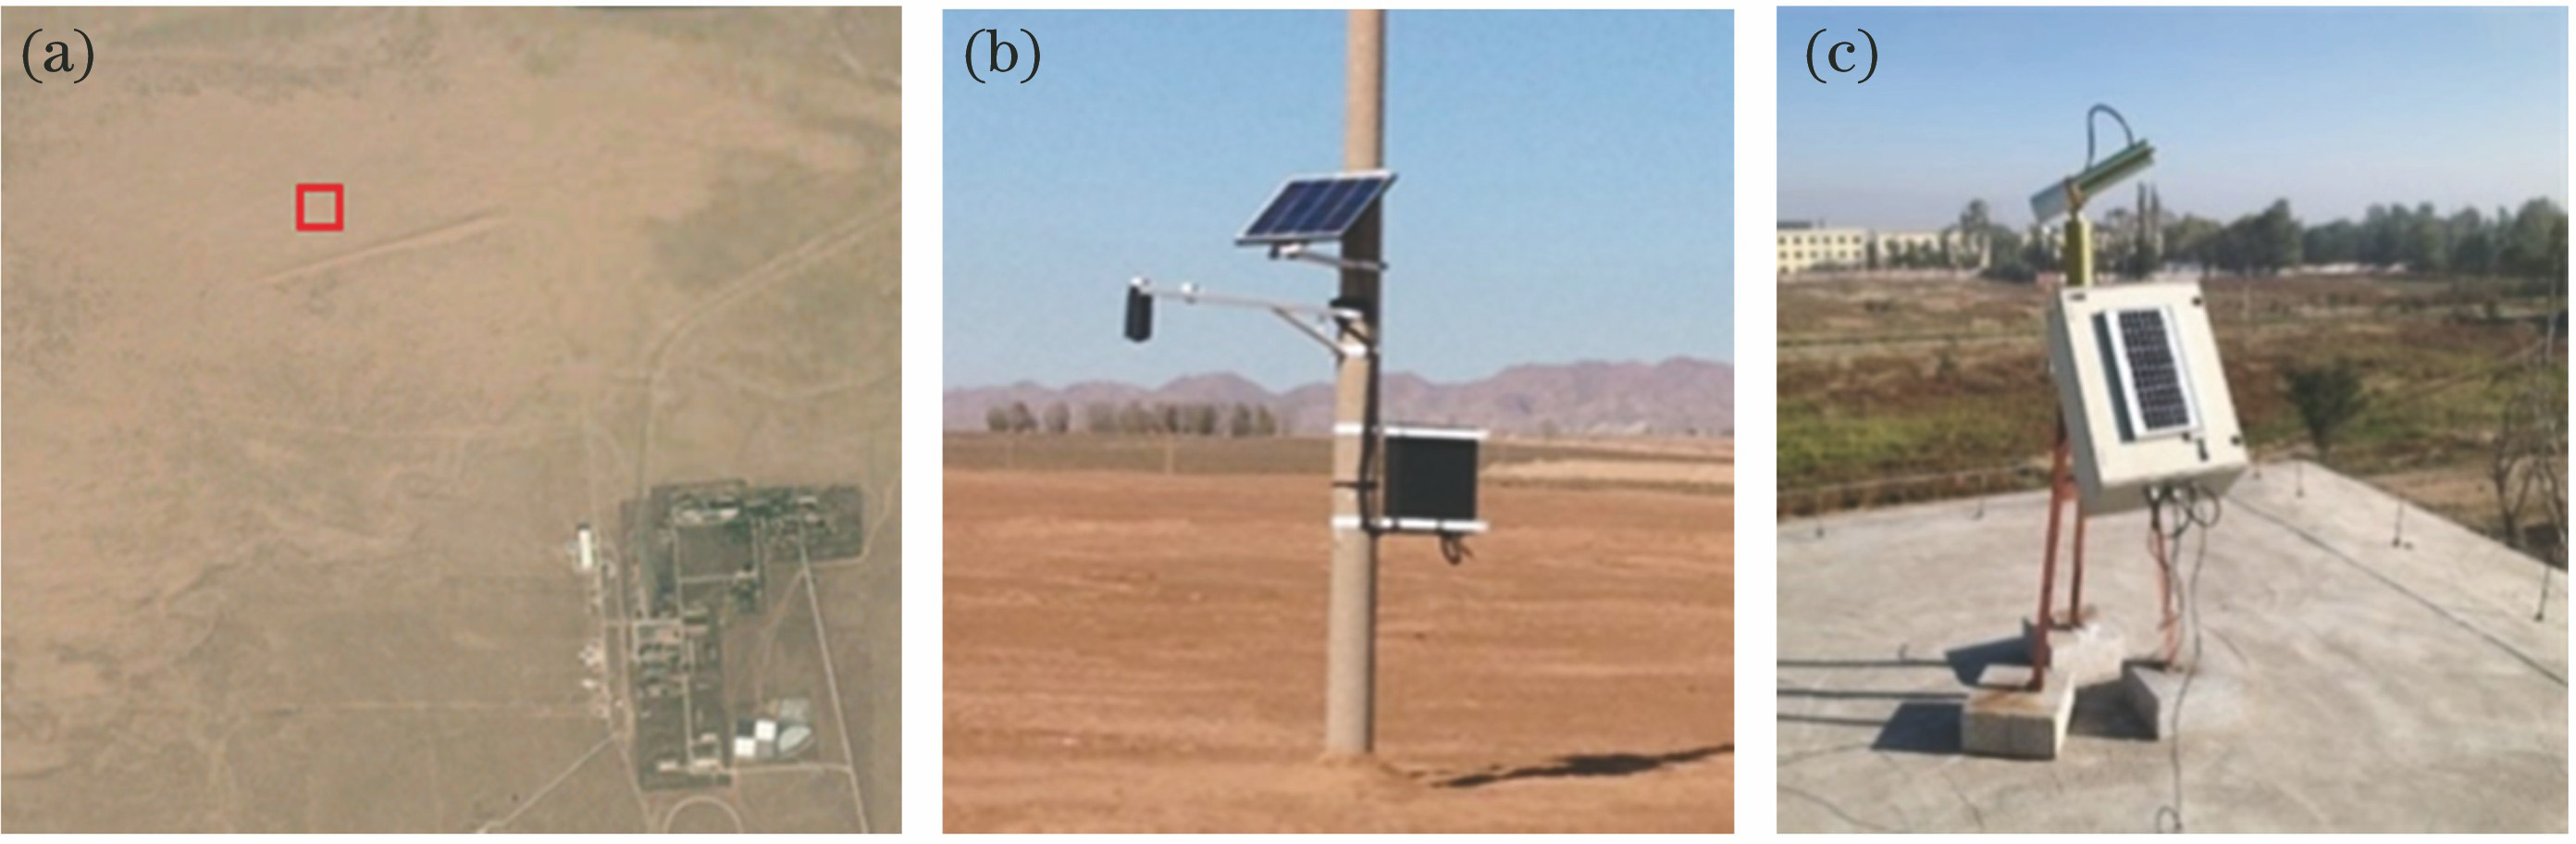
Fig. 1. Sand land target of Baotou site and automatic observation system. (a) Sentinel-2 scene of sand land target; (b) automatic observing system; (c) CE318 sun photometer
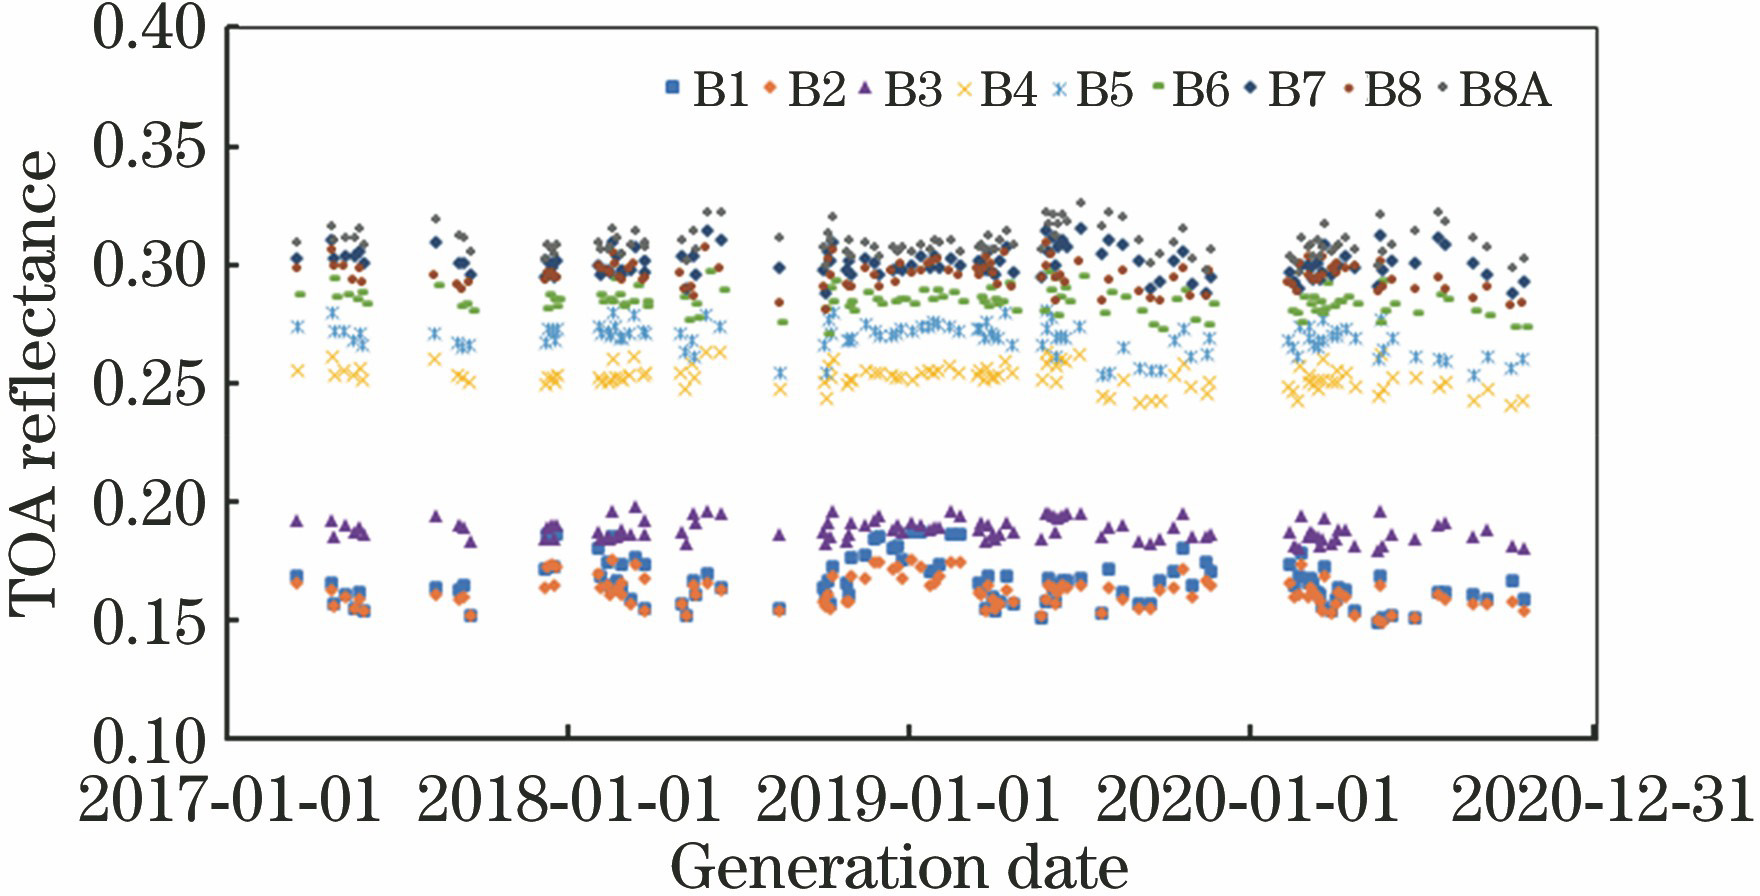
Fig. 2. TOA reflectance observed by Sentinel-2 over sand target from 2017 to 2020
Fig. 3. Atmospheric parameters at the time of Sentinel-2 satellite overpass Baotou site
Fig. 4. Flow chart of the satellite on-orbit radiometric calibration method based on TOA reflectance product over Baotou site
Fig. 5. TOA reflectance observed by Landsat-8 over Baotou site sand target from 2017 to 2020
Fig. 6. Model simulated TOA reflectance and Sentinel-2 observed TOA reflectance. (a)--(i) Band 1--band 8A, respectively
Fig. 7. Relative error between model simulated TOA reflectance and Sentinel-2 observed TOA reflectance
Fig. 8. Spectral response function of Sentinel-2. (a) Sentinel-2A; (b) Sentinel-2B
Fig. 9. TOA reflectance spectral correction coefficient (8 d)
Fig. 10. Relative error between TOA reflectance products (with and without correction) and Sentinel-2 TOA reflectance
| ||||||||||||||||||||||||||||||||||||||||||||||||||||||||||||||||||||||||||
Table 1. Chosen spectral bands of Sentinel-2 sensor (S2A & S2B)
| |||||||||||||||||||||||||||||||||||||||||||
Table 2. Fitting coefficient of empirical model of each band
|
Table 3. Relative error statistic between model simulated TOA reflectance and Sentinel-2 observed TOA reflectance
| |||||||||||||||||||||||||||||||||||||||||||||||||||||||
Table 4. Relative error statistic between TOA reflectance products (with and without correction) and Sentinel-2 TOA reflectance

Set citation alerts for the article
Please enter your email address
© Copyright 2018-2021 | Chinese Laser Press. All Rights Reserved 沪ICP备15018463号-20