• Acta Physica Sinica
  • Vol. 68, Issue 23, 234203-1 (2019)
Yao-Yao Zhou1、*, Peng-Fei Li1, Zhi-Hui Yan2、3, and Xiao-Jun Jia2、3
Author Affiliations
  • 1Department of Physics, Taiyuan Normal University, Jinzhong 030619, China
  • 2State Key Laboratory of Quantum Optics and Quantum Optics Devices, Institute of Opto-Electronics, Shanxi University, Taiyuan 030006, China
  • 3Collaborative Innovation Center of Extreme Optics, Shanxi University, Taiyuan 030006, China
  • show less
    DOI: 10.7498/aps.68.20191168 Cite this Article
    Yao-Yao Zhou, Peng-Fei Li, Zhi-Hui Yan, Xiao-Jun Jia. Analysis of entanglement source based on coherent feedback control[J]. Acta Physica Sinica, 2019, 68(23): 234203-1 Copy Citation Text show less
    Schematic diagram of the NOPA cavity with coherent feedback control.相干反馈操控NOPA的基本原理图
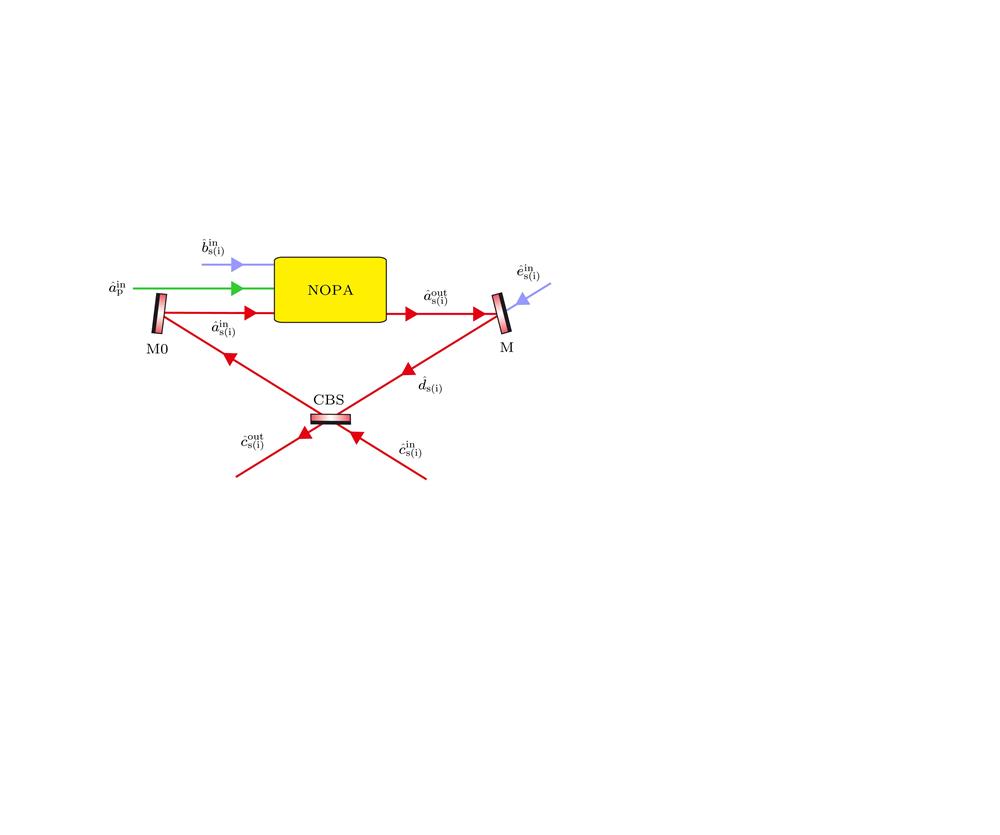
    Fig. 1. Schematic diagram of the NOPA cavity with coherent feedback control.相干反馈操控NOPA的基本原理图
    Quantum correlation noises of two quadrature components for two output beams from CFC-NOPA system versus the transmissivity of CBS for idle optical field. Each dashed curve represents the value of T2 when the quantum correlation noises of each curve is the minimum.CFC-NOPA系统输出光场正交分量之间的量子关联噪声与CBS对闲置光场的透射率之间的曲线关系, 虚线分别表示各个曲线的关联噪声值最小时T2的取值大小
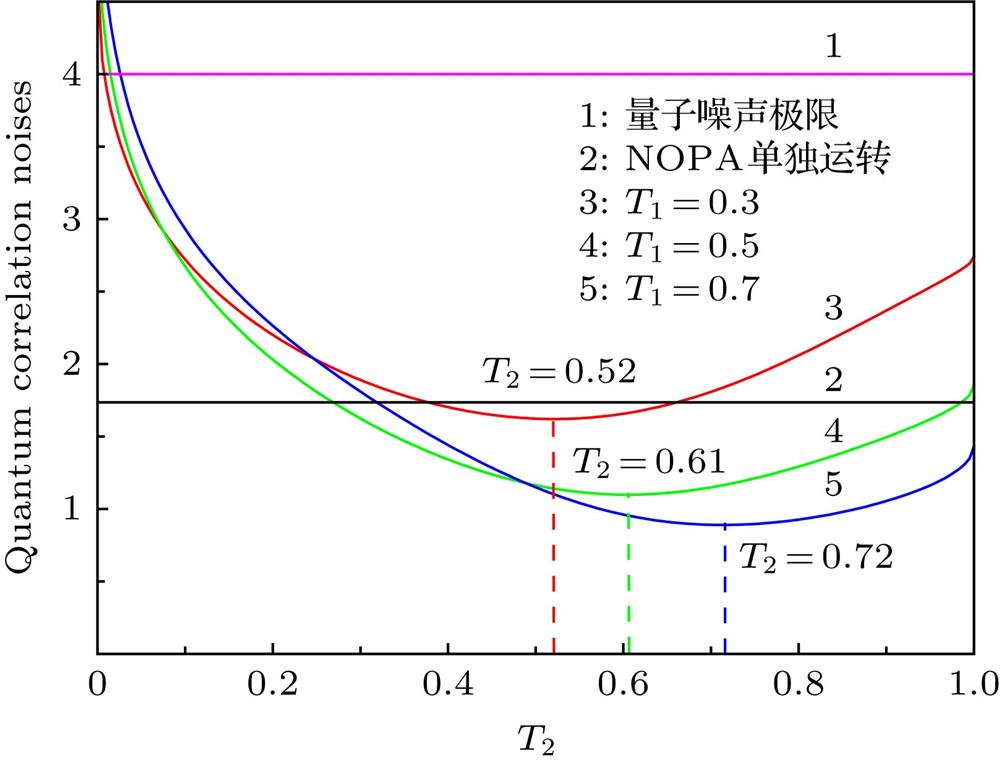
    Fig. 2. Quantum correlation noises of two quadrature components for two output beams from CFC-NOPA system versus the transmissivity of CBS for idle optical field. Each dashed curve represents the value of T2 when the quantum correlation noises of each curve is the minimum. CFC-NOPA系统输出光场正交分量之间的量子关联噪声与CBS对闲置光场的透射率之间的曲线关系, 虚线分别表示各个曲线的关联噪声值最小时T2的取值大小
    Dependences of the quantum correlation noises of two quadrature components for two output beams from CFC-NOPA system on analysis frequency: (a) Transmissivity T1 = 0.3; (b) transmissivity T1 = 0.5; (c) transmissivity T1 = 0.7; (d) transmissivity T1 = 0.7, 0.8, 0.9.CFC-NOPA系统输出光场正交分量之间的量子关联噪声随分析频率的变化曲线 (a) 透射率T1 = 0.3; (b) 透射率T1 = 0.5; (c) 透射率T1 = 0.7; (d)透射率T1 = 0.7, 0.8, 0.9
    Fig. 3. Dependences of the quantum correlation noises of two quadrature components for two output beams from CFC-NOPA system on analysis frequency: (a) Transmissivity T1 = 0.3; (b) transmissivity T1 = 0.5; (c) transmissivity T1 = 0.7; (d) transmissivity T1 = 0.7, 0.8, 0.9. CFC-NOPA系统输出光场正交分量之间的量子关联噪声随分析频率的变化曲线 (a) 透射率T1 = 0.3; (b) 透射率T1 = 0.5; (c) 透射率T1 = 0.7; (d)透射率T1 = 0.7, 0.8, 0.9
    Quantum correlation noises of two quadrature components for two output beams from CFC-NOPA system versus transmissivity of output coupler of NOPA. The red dashed curve represents the value of when curve 1 takes the minimum. The blue dashed curves represent the critical value of when the value of curve 2 is less than the minimum value of curve 1. The green dashed curves represent the critical value of when the value of curve 3 is less than the minimum value of curve 2.CFC-NOPA系统输出光场正交分量之间的量子关联噪声随NOPA输出镜透射率的变化曲线 红色虚线表示曲线1取最小值时的大小; 蓝色虚线表示曲线2的取值小于曲线1的最小值时的临界值大小; 绿色虚线表示曲线3的取值小于曲线2的最小值时 的临界值
    Fig. 4. Quantum correlation noises of two quadrature components for two output beams from CFC-NOPA system versus transmissivity of output coupler of NOPA. The red dashed curve represents the value of when curve 1 takes the minimum. The blue dashed curves represent the critical value of when the value of curve 2 is less than the minimum value of curve 1. The green dashed curves represent the critical value of when the value of curve 3 is less than the minimum value of curve 2. CFC-NOPA系统输出光场正交分量之间的量子关联噪声随NOPA输出镜透射率的变化曲线 红色虚线表示曲线1取最小值时 的大小; 蓝色虚线表示曲线2的取值小于曲线1的最小值时 的临界值大小; 绿色虚线表示曲线3的取值小于曲线2的最小值时 的临界值
    Schematic diagram of experimental setup. DBS: dichroic beam splitter; HWP1-2: waveplate; PBS1-3: polarizing beam splitter; BHD1-2: balanced homodyne detectors; SA: spectrum analyzer.实验装置示意图 DBS: 双色分束镜; HWP1-2: 波片; PBS1-3: 偏振分光棱镜; BHD1-2: 平衡零拍探测器; SA: 频谱分析仪
    Fig. 5. Schematic diagram of experimental setup. DBS: dichroic beam splitter; HWP1-2: waveplate; PBS1-3: polarizing beam splitter; BHD1-2: balanced homodyne detectors; SA: spectrum analyzer. 实验装置示意图 DBS: 双色分束镜; HWP1-2: 波片; PBS1-3: 偏振分光棱镜; BHD1-2: 平衡零拍探测器; SA: 频谱分析仪
    Experimental structure of the CFC-NOPA system.CFC-NOPA系统的实验结构图
    Fig. 6. Experimental structure of the CFC-NOPA system.CFC-NOPA系统的实验结构图
    Diagram of experimental measurement results: (a) The measured amplitude-sum correlation variances noise powers of the output beams; (b) the measured phase-difference correlation variances noise powers of the output beams. The measurement parameters of SA: RBW 10 kHz; VBW 100 Hz.实验测量结果图, SA: RBW 10 kHz; VBW 100 Hz (a)正交振幅分量和的量子噪声功率; (b)正交位相分量差的量子噪声功率
    Fig. 7. Diagram of experimental measurement results: (a) The measured amplitude-sum correlation variances noise powers of the output beams; (b) the measured phase-difference correlation variances noise powers of the output beams. The measurement parameters of SA: RBW 10 kHz; VBW 100 Hz.实验测量结果图, SA: RBW 10 kHz; VBW 100 Hz (a)正交振幅分量和的量子噪声功率; (b)正交位相分量差的量子噪声功率
    Yao-Yao Zhou, Peng-Fei Li, Zhi-Hui Yan, Xiao-Jun Jia. Analysis of entanglement source based on coherent feedback control[J]. Acta Physica Sinica, 2019, 68(23): 234203-1
    Download Citation