Abstract
Understanding shielding cross-effects is a prerequisite for maximal power-specific nanosecond laser ablation in liquids (LAL). However, discrimination between cavitation bubble (CB), nanoparticle (NP), and shielding, e.g., by the plasma or a transient vapor layer, is challenging. Therefore, CB imaging by shadowgraphy is performed to better understand the plasma and laser beam-NP interaction during LAL. By comparing the fluence-dependent CB volume for ablations performed with 1 ns pulses with reports from the literature, we find larger energy-specific CB volumes for 7 ns-ablation. The increased CB for laser ablation with higher ns pulse durations could be a first explanation of the efficiency decrease reported for these laser systems having higher pulse durations. Consequently, 1 ns-LAL shows superior ablation efficiency. Moreover, a CB cascade occurs when the focal plane is shifted into the liquid. This effect is enhanced when NPs are present in the fluid. Even minute amounts of NPs trapped in a stationary layer decrease the laser energy significantly, even under liquid flow. However, this local concentration in the sticking film has so far not been considered. It presents an essential obstacle in high-yield LAL, shielding already the second laser pulse that arrives and presenting a source of satellite bubbles. Hence, measures to lower the NP concentration on the target must be investigated in the future.Understanding shielding cross-effects is a prerequisite for maximal power-specific nanosecond laser ablation in liquids (LAL). However, discrimination between cavitation bubble (CB), nanoparticle (NP), and shielding, e.g., by the plasma or a transient vapor layer, is challenging. Therefore, CB imaging by shadowgraphy is performed to better understand the plasma and laser beam-NP interaction during LAL. By comparing the fluence-dependent CB volume for ablations performed with 1 ns pulses with reports from the literature, we find larger energy-specific CB volumes for 7 ns-ablation. The increased CB for laser ablation with higher ns pulse durations could be a first explanation of the efficiency decrease reported for these laser systems having higher pulse durations. Consequently, 1 ns-LAL shows superior ablation efficiency. Moreover, a CB cascade occurs when the focal plane is shifted into the liquid. This effect is enhanced when NPs are present in the fluid. Even minute amounts of NPs trapped in a stationary layer decrease the laser energy significantly, even under liquid flow. However, this local concentration in the sticking film has so far not been considered. It presents an essential obstacle in high-yield LAL, shielding already the second laser pulse that arrives and presenting a source of satellite bubbles. Hence, measures to lower the NP concentration on the target must be investigated in the future.Introduction/Motivation
Since the 1990s, laser ablation has evolved into a promising nanoparticle (NP) synthesis method1, rapidly growing since about 10 years2, and today even attracting industrial attention3, 4. By enabling the production of a wide variety of material-liquid combinations5-7 of ligand-free NPs8 in a g/h scale9, laser-generated particles became of high interest for the fields of catalysis10, biomedicine11, cancer therapy12, 3D printing13-15, and analytical chemistry16, 17.
A high NP productivity, i.e., the mass of nanoparticles produced per time, is required to make laser ablation in liquids an economically feasible production method for colloid production18, especially for two of the fields mentioned above: catalysis and 3D printing. As described by ref.19, NP productivity is proportional to
, where F is the laser fluence, while the maximal power-related productivity is found at a fluence of
, with F0 being the material-dependent threshold fluence19. Often reports indicate that high-power laser ablation operates far above this optimal fluence range20-22. This model described in ref.19 was initially developed to describe the laser ablation in air23 with the pulse duration-dependency of the productivity being indirectly considered by the penetration depth24-30 and the threshold fluence20, 31-37. Later, it was shown that the model is also able to describe the productivity of laser ablation in liquids22. However, for ablation in liquids, not only the pulse duration-dependent penetration depth and threshold fluence need to be considered by the model, but also the interaction of the laser beam with the liquid and the emerging NPs38, 39. The NP shielding effect in dependence on the laser pulse duration has not been investigated so far for nanosecond pulses. However, a productivity loss for ns pulse durations increasing from 19 to 150 ns for ablation in water is reported but could not be observed for ablation in air40. Although this effect was not fully understood, that study demonstrates that pulse duration-dependent shielding effects influence the productivity of laser ablation in liquids. In addition, the influence of the local NP concentration, which can significantly differ from the global concentration, has not been considered so far.
When a laser pulse interacts with a metal target, the laser energy initially heats the electrons. The excited electrons transfer their energy to the lattice by collision processes. Due to the high mass difference between electrons and the lattice, the energy transfer requires several ps. Therefore, for pulse durations below the electron-phonon coupling time of specific material, physical processes occur more or less subsequently, whereas they overlap during ablation with ns pulses41. As soon as a plume is formed, energy is dissipated into the surrounding liquid, leading to vapor formation at the water layer interface. These processes have been extensively studied by simulations42-44 and experiments45, 46. It is reported that the cavitation bubble emerges from the vapor covering the plume47, 48. The energy transfer from the electrons to the lattice is material dependent and occurs in times in the order of picoseconds for metals41.
During ablation with fs and ps laser pulses, the laser energy is converted into the plasma46. In contrast to sub-ps and ns, where the laser energy is partially used to sustain the plasma resulting in high plasma lifetimes40, 49. However, when a critical electron density in the plasma is reached, the laser beam can no longer penetrate the plasma and is reflected, resulting in decreased ablation efficiency40. Vogel et al. calculated that the plasma absorption coefficient decreases from sub-fs to sub-ns pulse durations for a wavelength of 1064 nm from about 800 cm-1 at 300 fs to 200 cm-1 at 10 ps due to the high electron density generated by cascade ionization50. For ns pulses, the absorption coefficients were not determined and the values strongly depend on the laser intensity. Moreover, for the rising edge of a ns laser pulse, the energy is mostly transmitted. However, the free electron density raises so that during the falling edge of the laser pulse, most of the laser energy is absorbed50. Also, for ns ablation, laser energy is absorbed by inverse Bremsstrahlung by the plume resulting in a higher plume temperature51 and, consequently, a longer plasma lifetime of up to 1200 ns49. The higher energy density and pressure within the plume cause the transformation of the laser energy into mechanical energy to be larger for ns than for ps pulses52. In ref.47, it was also found that for a pulse duration of 19 ns, the plasma exceeds the boundary of the cavitation bubble; for a pulse duration of 50 ns, the plasma boundary approximately coincides with the cavitation bubble boundary; and for 100 ns, the cavitation bubble boundary exceeds the plasma. When a critical electron density in the plume is reached, the laser beam can no longer penetrate the plume leading to lower ablation efficiencies for longer laser pulses40, typically termed as plasma shielding. In addition, atomistic simulations revealed that for increasing pulse durations from 400 ps to 2 ns and fixed absorbed fluences, the amount of ejected material is reduced due to heat losses44. On the other hand, roughening of the interfacial layer between the metal and water environment, i.e., formation of a transient metal layer, occurs within the first ~2 ns44, possibly favoring the intrapulse absorption during longer ns pulses. The energy absorbed and dissipated by these transient states is difficult to quantify due to their dependence on numerous parameters. The quantification of energy dissipation is further complicated by the temporal changes of the material surface during the laser pulse impact37.
Although the absorbance of, e.g., gold (with an absorption coefficient of 8 × 105 cm-1) or silver (with an absorption coefficient of 9 × 105 cm-1) as bulk materials in the infrared spectrum range is low26, the role of the NP concentration in the liquid is often discussed concerning the laser light attenuation and the resulting productivity decrease4. Also, the bubble formation around NPs has been investigated in former studies53-59. It was shown that for 30 nm Au NPs and a fluence of 0.3 J/cm2, the bubble radius already exceeds 110 nm55, 58, and the amount of absorbed energy is larger for smaller NPs60. Contrary to the cavitation bubble on the target surface, the laser pulse duration does not influence the bubble size found around the NPs55. However, the influence of such nanoparticle-related vapor bubbles on the target ablation process has hardly been studied since the literature mainly focused on using vapor bubbles for imaging and therapies. Kalus et al. presented attempts to quantify the energy absorption by the NPs. They found that for Au concentration of 50 mg/L, 25% of the laser energy is absorbed38, 39. For vapor bubbles on the other side, a bubble of 30 nm radius around a 10 nm Au NP is observed for irradiation with a 1 ns laser at a fluence of 0.5 J/cm255 while for increasing laser fluences this radius even increases60.
In this study, we perform shadowgraphy to observe the cavitation bubble dynamics during laser ablation with a 1 ns laser and compare our findings with the literature values obtained for ablation with a 7 ns laser to gain insight into the ablation phenomena in the ns ablation regime. A laser with a pulse duration of 1 ns is chosen since it revealed the highest ablation efficiency so far20. This pulse duration can be realized with high-power q-switched laser systems61. On the contrary, 7 ns is an interesting pulse duration since ablations performed with a laser having this pulse duration showed a significant decrease in the ablation efficiency compared to ablation with a 1 ns laser20. Also, pulse durations of 1 to 10 ns is the industrial standard of high-power ns lasers. Moreover, the laser beam-liquid interaction is analyzed under consideration of non-linear effects. Lastly, the extent of the NP-laser beam interaction and its effect on the cavitation bubble dynamic is demonstrated. Thereby, the NPs caught in the stationary liquid layer, present in front of the target even under liquid flow conditions, are used to investigate the influence of the local NP concentration on the ablation mechanism.
Methods and materials
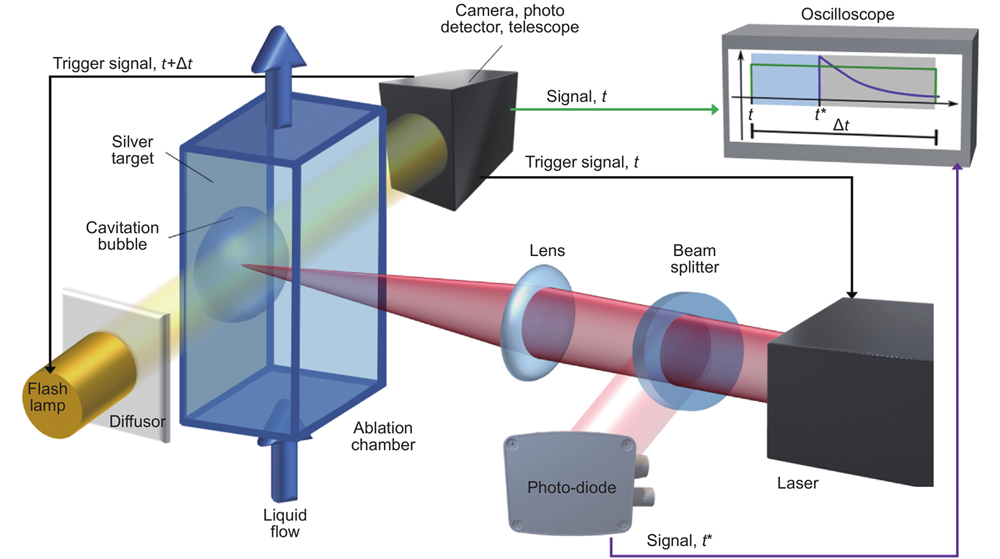
The experimental setup is shown in Fig. 1. For the imaging, a liquid flow chamber with a flow rate of 10 mL/min and a liquid layer height above the target of 5 mm was used, similar to the ablation setup used in ref.62. All experiments were conducted with a silver target of 1 mm thickness and with deionized MilliQ water. A microchip laser (CryLaS, eMOPA1064-400) with a pulse duration of 1 ns, pulse energy of about 400 µJ, and a wavelength of 1064 nm was focused by a combination of two lenses, each with a focal length of 100 mm.

Figure 1.Shadowgraphy setup for cavitation bubble imaging during 1 ns, Q-switched laser ablation in water; the solid black lines represent the trigger signals sent by the camera. Also, the signal of the camera and the photodiode are sent to an oscilloscope. In the exemplary oscillogram, the camera and laser pulse signals are shown. The blue-shaded area in this diagram represents the laser's response time to the trigger signal and the gray-shaded area the resulting corrected delay time, which is the time between the laser pulse and the moment of image acquisition.
For the image acquisition, an ICCD camera (Andor i-Star, DH334T-18H-13) and a Xenon flash lamp (Hamamatsu, L4633-01) were used. The image quality was improved by placing a diffusor between the lamp and the ablation chamber. Additionally, a telecentric telescope (Sill Optics, Correctal T/1.5, and Edmund Optics, 4X, 65 mm CompactTL Telecentric Lens) is positioned in front of the photodetector. One image is acquired per laser shot, and maximal 100 shots are applied on one spot to avoid a pulse number dependent change in the cavitation bubble. As demonstrated in the literature, the maximal number of laser pulses applied per spot before the CB size decreases are dependent on the laser energy63 and does not change during the first 100 shots at 20 mJ and 11 J/cm262. The camera is used as a trigger in this study. It sends independent trigger signals to the flash lamp and the laser (solid black lines in Fig. 1) so that by varying the delay time difference of the laser’s and the lamp’s trigger signal, the temporal evolution of the cavitation bubble can be examined. However, the laser system responses with a fluctuating internal delay to the trigger signal, so that the real delay time must be determined with an oscilloscope. Therefore, a signal is transmitted from the camera to the oscilloscope simultaneously with the laser trigger signal (green line in Fig. 1). For the laser pulse detection, the beam is split by a 10:90 beam splitter. A photodiode detects the minor part of the laser pulse, and its signal is transmitted to the oscilloscope (purple line in Fig. 1). The image acquisition time was 100 ns for all images. For the first two sections of this paper, the delay time is varied between 5–100 µs to observe the lifetime of the first cavitation bubble. In the following, the volume of the cavitation bubble at its maximal expansion is calculated by measuring the bubble width and height and assuming an elliptical quasi-hemisphere. In the last section, a constant delay time of 11 µs is chosen. To ensure that all NP are removed from the bulk liquid in-between shots, one image is acquired every three seconds.
In the following, the laser power will be varied by using reflective filters, and the laser power is measured with a power meter (Coherent Inc., FieldMaxII-TOP). For the fluence calculation, the spot size is determined, as described in ref.64. For the variation of the focal distance, the imaging chamber is mounted on a precise micrometer stage. The productivity in this section is determined gravimetrically. For the size analyses, the NPs are stabilized with 0.1 mmol/L tetraethylammonium hydroxide (TEAH) solution and measured 18 h after production. The hydrodynamic diameter distribution is determined by an analytical disk centrifuge (CPS, DC24000). When the laser shots are performed in the colloid instead of pristine water, the concentration is also determined gravimetrically.
Results and discussion
In the following, the CB's volume dependence on the laser fluence by varying the laser energy is compared to literature results. The differences in the CB dynamic are discussed as a possible explanation of the different ablation efficiencies for both lasers. Another way to alter the laser fluence is to change the focal spot size. Since in literature, the change in the colloidal quality for different focal distances is reported4, we use our shadowgraphy setup to investigate possible laser-fluid interactions. Lastly, it is already shown that a µg/L NP concentration is sufficient to vary the CB size and dynamic, and how local versus global NP concentration affects cavitation.
Comparison of the cavitation bubble volume for different pulse durations
Exemplary cavitation bubble images at five different laser fluences, ranging from 0.4 to 14 J/cm2, can be found in the Supplementary information (Fig. S1). The total bubble energy is the sum of the adiabatic expansion, the surface energy, and the potential energy65. For CBs, which usually have a radius of least several hundreds of µm, the contributions of the adiabatic expansion and surface increase are negligible, so that
can be used to calculate the bubble energy. For a bubble expansion from 0 to 0.16 mm3 16 µJ, i.e., 4% of the laser energy, is required. In the laser ablation setup, the laser pulse is the only energy source so that at a constant focal distance, the bubble volume is expected to scale linearly with the laser fluence or laser intensity at a fixed laser pulse duration. Since the NP productivity scales with the laser fluence22, it may also be expected to observe a correlation between NP productivity and the cavitation bubble volume. Regardless of the laser pulse duration, the NP formation is driven by the plasma dynamics66. However, the linear correlation between the laser fluence and the CB volume is only observed for a limited laser fluence range of 50–175 J/cm2 for 7 ns pulse duration in the literature (Fig. 2(b))67. Especially for the low fluence regime, the observed cavitation bubble volume is lower than expected, which is assigned to the plasma ignition threshold by the authors67.
Figure 2.The maximal cavitation bubble volume for different laser intensities are shown for a 1 ns laser (a) and a 7 ns laser (b)67. The productivity m and the ablation efficiency m _spec in (b) are taken from ref.20. For both lasers, the productivity and ablation efficiency are determined at 12 J/cm2. Moreover, the powerspecific maximal CB volume is shown for both lasers (c).
In Fig. 2(a), the fluence-dependent bubble volume is shown for 1 ns pulse duration. In the literature, the spallation regime at low fluences and the phase explosion regime at high fluences are observed with single-pulse experiments, showing a logarithmic productivity-fluence trend similar to the cavitation bubble volume-fluence plot (Fig. 2(a))22, 68. When comparing lasers with different pulse durations (Figs. 2(a) and 2(b)), the maximal productivity for the 1 ns laser (9 mg/h) is lower than that of a 7 ns laser system (35 mg/h) at the same fluence of 12 J/cm2, as is the cavitation bubble volume. However, the 1 ns laser reveals significantly higher power-specific productivity than the 7 ns laser system, with 36 mg/(W·h) compared to only 7 mg/(W·h) (Figs. 2(a) and 2(b)). In ref.20, it was shown that the 1 ns laser showed higher power-specific productivity, also called ablation efficiency, than 3 ps and 10 ns lasers. At first glance, productivity seems to be the more relevant factor since it provides the obtained NP mass. However, the ablation efficiency gains importance when evaluating the process performance since it enables process comparison69 and the determination of energy losses. In ref.62, it is hypothesized that not only the laser fluence but also the plume dynamics determine the ablation rate. Since the plume formation is stated as the starting point of the CB47 and additionally, it is reported that for ns pulses, the laser pulse sustains the plasma40, it is hypothesized that when the plume absorbs more energy, the CB will grow larger. In other words, the amount of laser energy per CB volume can be considered as “lost energy” for the formation of NPs. When comparing this energy-specific cavitation bubble volume (Fig. 2(c)), it is higher for the 7 ns laser, indicating that the plume absorbs a larger amount of laser energy. The higher energy-specific cavitation bubble volume for the 7 ns laser agrees with the literature result, in which larger CB47 and lower productivities40, 70 are observed by increasing pulse durations. The maximum energy-specific cavitation bubble volume for the 7 ns curve lies between 10 – 15 GW/cm2, which coincides with the threshold intensity for the optical breakdown of 12 GW/cm2 for 6 ns at 1064 nm for the case that seed electrons are present in the liquid50. For a deeper understanding of the ablation efficiency, plasma analysis, especially in the pulse duration range from sub-ns to ns, would be required.
In conclusion, it is hypothesized that the increased laser-plume interaction for larger pulse durations leads to larger CBs, at the expense of lower NP mass yield. Also, the laser energy transmittances already decreased during the temporal rising edge of the laser pulse for longer pulse durations (e.g., 9 ns in ref.37). Consequently, both effects lead to a significantly increased ablation efficiency with decreased laser pulse duration. Simultaneously, compared to ultrashort pulses, moderate intensities of the 1 ns laser are less prone to optical breakdown in the liquid, allowing the ablation pulse to reach the target.
Influence of the focal plane shift on the cavitation bubble dynamics
Several studies investigated the influence of the focal plane position on NP productivity and size4, 71-74. In general, smaller NPs are observed when the laser beam is focused on the liquid layer. In contrast, higher productivities are observed when the focal plane lies slightly behind the target surface4, 73. One explanation is that a high laser fluence in the liquid layer leads to the fragmentation of NPs, and the consequent loss in laser energy results in lower NP productivity. By examining the CB in relation to the focal plane position relative to the target surface, it is expected to observe smaller CB sizes with smaller NPs, when the laser focus lies in the liquid layer.
Images of the emerging, maximal, and shrinking cavitation bubble at different focal distances are shown in Fig. S2, and the whole parameter series is summarized in Fig. 3. The maximal cavitation bubble volume is observed at a target-lens distance of 54.0 mm, which does not correlate with the highest nominal laser fluence on the target surface (Figs. 3(a) and 3(b)), which is found at a slightly higher target-lens distance of 54.5 mm. Moreover, during the bubble expansion phase, a smaller satellite bubble or a cascade of satellite bubbles in front of the cavitation bubble can be seen for distances between 54.0 and 54.5 mm (see the gray shaded area in Fig. 3). Streaks of microbubbles along the beam path have been observed in several ps and ns cavitation bubble studies33, 75, 76 and have been assigned to localized boiling of the liquid induced by NPs. Vapor bubbles, which enclose NPs, already occur for fluences at around tens of mJ/cm277, which is well below the ablation threshold fluence of hundreds of mJ/cm2 to several J/cm237, 78. These vapor bubbles scatter a significant amount of laser energy since the vapor bubble is about twice as large in radius as the present NP58.
Figure 3.The distance between the target surface and the lenses is varied for the 1 ns laser system at maximal laser power, the resulting nominal change in the laser fluence (a), the determined maximal cavitation bubble volume (b), the corresponding productivity (c), and the mass fraction of particles < 10 nm are shown. The gray area in (a) – (d) marks the focal distances where bubble cascades are observed. The exemplary images show bubbles at distances shorter than (orange), within (yellow), and larger (green) than the range where successive bubbles occurred.
However, the observed bubble cascades look different from those microbubbles observed in the literature (compare Fig. S3, Fig. S4, and ref.75). Additionally, productivity at the respective distances is examined. Interestingly, Fig. 3(c) shows that the maximal productivity of 3 ng/pulse is found at 53.3 mm, where the nominal fluence on the target surface is only about a third of the maximal fluence reached in this study and the focal plane lies behind the target surface4, 73. Since the fluence inside the liquid layer increases with larger lens-target distances, it is considered that the laser beam interacts with the NPs in the liquid and possibly leads to a size manipulation. Moreover, for fs LAL, there is a critical maximal NP radius that will be fragmented79. Therefore, the change in the particle size fraction <10 nm is a good indicator of changes in the NP size distribution.
The nanoparticle size change due to the changing focal plane is shown in Fig. 3(d). Exemplary hydrodynamic size distributions can be found in Fig. S6. Beginning at a focal plane distance of 51.3 mm, the mass fraction of particles <10 nm slowly increases until a constant size fraction <10 nm of 45% is reached at 54.3 mm. As already known from former studies, the NPs interact with the laser beam and lead to NP size manipulation, dependent on the laser fluence 80, 81. Under certain conditions, for low laser fluences, nanoparticles can melt together, which is termed as laser melting in liquids82. A NP size decrease is observed for high fluences, up until just below the optical breakdown threshold81, which is referred to as laser fragmentation in liquids83.
When increasing the lens-target surface distance, the focal plane of the laser beam shifts from a virtual focal plane behind the target to a focal point in the liquid layer in front of the target, which is sketched in Fig. 3(a). At this focal distance, the point of highest laser fluence lies within the liquid layer so that the surrounding nanoparticles interact with a high-fluence laser beam, resulting in a nanoparticle size decreasing84. The limit for non-linear optical effects is reported to be in the range of hundreds of GW/cm2 to TW/cm2 depending on the laser pulse duration50. In the case that seed electrons, which can be ejected from the target due to the laser pulse impact, are present, the threshold intensity of optical breakdown at a pulse duration of 1 ns pulse is decreased to 10 − 20 GW/cm 250. NPs present in the liquid also significantly decrease this threshold2. The reduced breakdown threshold means that although nanosecond laser pulses are used for the presented experiments, the optical breakdown can occur within the gray shaded area in Fig. 3.
When comparing the bubble cascade images to those of optical breakdown in water, they reveal similarities52, 85. For distances larger than 55.0 mm, the cavitation bubble size decreases drastically, and no succeeding bubbles are observed. We assume that for these distances, the area where the next bubbles occur are not visible in the image anymore since the total width of the images shown in Fig. 3 measures about 1.2 mm and the liquid layer height approx. 5.0 mm. We also observed non-hemispherically shaped bubbles with spike-like structures at their center point (examples in Fig. S3 and Fig. S4). Moreover, ripple-structures at the bubble's center point are observed, looking similar to the coalescence of a bubble with a fluid86. The observation of ripple-structures indicates the merging of succeeding bubbles to one larger bubble, which explains the larger bubble volume occurring where succeeding bubbles are observed and the abrupt bubble volume decrease at 55.0 mm distance. Here presumably, the distance between the breakdown bubble and the cavitation bubble is too large for both to touch and merge.
As expected, the NP size decreases when the focal plane is shifted into the liquid layer and, simultaneously, the CB size is drastically decreased. These observations indicate that laser energy is lost by the formation of the bubble cascade and additionally scattered at the bubble interfaces. The energy dissipated in the liquid layer could trigger NP fragmentation, whereas the reduced laser energy reaching the target surface and in the liquid layer leads to decreased NP mass yield. Despite this general trend that links fluence with CB size and NP productivity, in detail, at conditions of maximized nanoparticle production, neither cavitation bubble volume nor the laser fluence is maximal. Moreover, bubble successions are observed for focal planes in the liquid layer indicating the NP-laser beam interaction in the liquid layer, leading to NP size reduction.
Alteration of the cavitation bubble dynamics by variation of the global and local nanoparticle concentration in the surrounding liquid
When NPs are present in the liquid layer, it is expected that the laser energy is absorbed and scattered by the NPs. This absorption decreases the laser energy reaching the target surface so that a smaller cavitation bubble is observed. When NPs favor the optical breakdown, the energy difference between cavitation bubbles surrounded by pure water and bubbles surrounded by colloid is expected to be larger when the intensity in the liquid layer is high, i.e., the focal plane is shifted in the liquid layer. The total bubble energy is the sum of the adiabatic expansion, surface energy, and the potential energy65. For gas bubbles expanding into the water at ambient pressure, it is calculated that at larger sizes discussed here, the size dependence of the surface tension plays a minor role in the energy balance and the bubble volume is linearly proportional to the bubble energy.
In the following, the volume difference between a bubble in pure water and a bubble produced inside a colloid will be expressed as an energy difference as a rough measure to which extend the colloid possibly absorbs part of the laser energy. The corresponding results are presented in Fig. 4. It can be seen that for the same NP concentration, e.g., for 20 mg/L, the energy difference is about 16 µJ when the intensity is low in the liquid layer and increases to more than 19 µJ when the intensity in the liquid layer is increased. The bubble images in Fig. 4 also show the bubble cascade for the latter case, indicating the laser beam interaction with the NPs and liquid is even stronger when the focal plane lies in the liquid layer.
Figure 4.Energy difference of CBs produced in a pure colloid compared to the respective CB produced in water with different colloid concentrations and with the focal plane shifted into the liquid layer (dark blue squares) as well as the focal plane virtually shifted behind the target (light blue circles) (a). Images show exemplary CBs with the focal plane shifted into the liquid layer (b) and virtually shifted behind the target (c) at a NP concentration of approximately 20 mg/L as marked by the squares in (a).
As expected, the absorbed amount of laser energy scales with the NP concentration. However, the question of the extent of shielding by local and minimal NP concentration arises. Hence, experiments comparing two consecutive pulses under different conditions are performed to achieve minimal local NP concentrations and show the extent of the laser beam-particle interaction. In laser ablation flow chambers with typical flow channel diameters of 5 mm and flow rates in the order of 10 mL/min, the Reynolds numbers are so low that laminar flow conditions are ruling the flow profiles. According to the film theory87, during laminar flow over a plate, a stationary film with the thickness
is formed. Where
is the diffusion coefficient, estimated by the Stokes–Einstein equation, of a component A within the fluid B and
is the mass transfer coefficient. For NPs of 30 nm, a diffusion coefficient of 1.5×10⁻¹¹ m2/s is calculated (see SI). The mass transfer coefficient can only be estimated using an empirical equation consisting of the Sherwood and Reynolds number resulting in 5.4×10⁻⁶ m/s so that the film thickness is calculated to be 2.7 µm. At the given experimental conditions of 0.5 Hz and 10 mL/min, the productivity is 1 ng/pulse and a bulk concentration of 3 µg/L is achieved. It is assumed that the local NP concentration is the same since the NP mix in the bulk liquid after the CB collapse and those in contact with the walls are trapped in the formed stationary layer.
When comparing the first and second pulse (Fig. 5), microbubbles appear around the cavitation bubble. In the ns study from Letzel et al., satellite bubbles were observed62. The authors hypothesized that the crater formation due to the hole drilling could cause satellite bubble formation62. In another study, re-deposited nanoparticles sticking to the target were explicitly not excluded as an origin of the satellites88. Here, we provide an indication that NPs caught in the stationary liquid layer could be the source of these satellite bubbles.
Figure 5.The sketches illustrate the stationary liquid layer above the target and the first cavitation bubble of an image sequence (a). The formed NP are partially trapped in the stationary layer leading to satellite bubble formation, as shown in the sketch, and observed experimentally (b); please note that the sketches in the middle are not depicted on the correct time scale for the sake of the message, the scale bar measures 250 µm.
Former studies showed that for a constant laser pulse energy, the cavitation bubble size depends on the number of laser shots on the respective spot63. Presumably, due to the intensified coupling of the light into the material by incubation of defects or surface roughening, the bubble size increases for the first shots until about the tenth pulse63. It then decreases once the depth of the drilled hole (500 µm in the study of Letzel et al.62) limits the cavitation bubble expansion and the shape of the cavitation bubble transforms from hemispherical to almost spherical63. For the given experimental parameters, constant bubble size is determined after about 15 pulses (Fig. S5). In order to exclude these CB size changes caused by a material modification, the comparison of consecutive bubbles after the 25th and the 26th laser pulse is chosen, since here a constant bubble size is reached.
Figure 6 shows these two bubbles, and, as can be seen in Fig. 6(a), the sizes of the two consecutive bubbles differ by about 15% within the steady bubble size regime. The experiment runs under liquid flow conditions and a low repetition rate, where the hydrodynamic residence time is low and sufficient to remove the NPs inside the liquid from the laser beam path before the next pulse. In laminar flow conditions, the NPs in the main flow channel can easily be removed from the bulk liquid, but not from the stationary film. This film and the enclosed NPs will stay in front of the target, even at flow conditions.
Figure 6.The influence of the NP in the stationary liquid layer is examined under liquid flow conditions by comparing the CB size of consecutive laser pulse with and without a cleaning procedure in between. After 25 laser pulses, the stationary liquid layer is enriched with NP, and a constant cavitation bubble size is reached (a). When the ablation chamber and target are rinsed between two consecutive pulses, a NP-free stationary liquid layer is generated, leading to the formation of an increased cavitation bubble and the absence of satellite bubbles (b), the comparison of the volume increase between the 25th and 26th pulse for (a) and (b) is plotted in (c).
In this study, the liquid is entirely removed from the ablation chamber, the target rinsed, dried, and the chamber filled with freshwater between the 25th and 26th pulse to probe the effect of NP present in this layer. A bubble size increase of about 140% is observed (Fig. 6(b)) and leads to the conclusion that even minimal amounts of NPs inside the stationary film lead to a significant decrease of the cavitation bubble volume, presumably due to energy extinction by the trapped NPs. Moreover, at the 25th pulse (Fig. 6(b)), smaller satellite bubbles surrounding the cavitation bubble in a hemispherical shape can be observed but are not observed after manually refreshing the stationary liquid (26th pulse). Previous studies assumed that the confinement of the cavitation bubble by the ablation crater leads to material ejection from the bubble into the surrounding62. We can now specify that the crater confinement alone does not lead to material ejection from within the cavitation bubble. Instead, they (also) originate from nanoparticles caught in the stationary liquid layer.
The occurrence of satellite bubbles was also shown for ps laser pulses in ref.88, where it is associated with the jetting of micro-droplets into the dense water region above the cavitation bubble. In molecular dynamics simulation, the jetting of larger NPs from the cavitation bubble into the surrounding liquid was only seen for ps laser pulses but not for ns laser ablation, where the NPs are caught in the cavitation bubble until its collapse44. This simulation emphasizes our hypothesis that the observed satellite bubbles for ns pulses result from NPs captured in the stationary liquid layer. In literature, hemispherical shockwave propagation was observed before the cavitation bubble expands76, 89. Former studies already reported the formation of microbubbles along the laser beam path as a result of NP interaction with the incident laser beam76. However, in our case and as shown by ref.62, microbubbles form around the cavitation bubble. Therefore, it is assumed that particles act as seeds for shockwave energy dissipation by the vaporization of the liquid around the NPs.
In conclusion, it is found that the interaction of the NPs with the laser beam is stronger when the focal plane is shifted into the liquid layer and for high NP concentrations in the liquid. Additionally, it is observed that even the minute amount of NPs produced with one single laser pulse is sufficient to shield about (0.4±0.002)% of the laser energy, completely change the bubble morphology, and causes the satellite bubbles during ns laser ablation in liquids.
Conclusion
In the past years, multiple cavitation bubble studies were performed, focusing on its dynamics and connection with the nanoparticle formation mechanism. However, hardly any study thoroughly examined the influence of different energy distribution channels such as temporal or spatial energy distribution (i.e., pulse duration or focusing and defocusing) of the laser beam or absorption by nanoparticles.
In general, for different temporal energy distributions, a significantly larger cavitation bubble for longer pulse durations, i.e., ≥7 ns, is observed, presumably due to an enhanced laser-plume-interaction. It is assumed that longer pulse durations sustain the ablation plume, which gains more energy that, in turn, is released in larger CBs, and favors temporally dependent intrapulse absorption by a transient metal layer. Consequently, less energy is converted into mass ablation, so that the ablation efficiency is decreased for higher ns pulse durations and found to be highest for a 1 ns laser.
When keeping the temporal energy distribution constant and changing spatial energy distributions by varying the focal distance, it was found that the point of highest fluence and maximal bubble volume do not coincide. In a regime where the focal point is slightly above the target surface, a succession of bubbles and a decreased NP size are observed, strengthening the hypothesis that NPs are fragmented. However, the extent to which the fragmentation in the liquid, the changed fluence on the target surface, the plasma dynamics, or the laser-induced cavitation bubble dynamics contribute to the size modification cannot be quantified and further explanations cannot be excluded. Additionally, the resulting energy loss leads to reduced productivity, which is further emphasized because, with higher NP concentrations in the liquid, the energy decrease is even more substantial.
The cavitation bubble imaging experiments were performed in a liquid flow chamber with flow velocities sufficient to remove NPs from the chamber's main flow channel in-between laser pulses. However, satellite bubbles were observed at each cavitation bubble after the first one, which indicates the presence of NPs in a stationary liquid layer on the target surface. The incident beam causes vapor bubble formation around the NPs and therefore leads to a larger fraction of scattered laser light. Removal of the NP enriched stationary liquid layer leads to a bubble volume increase of 140%.
Overall, these results point to two future measures: First, cavitation and satellite bubble imaging experiments must be planned carefully and take local NP concentrations into account to understand LAL dynamics. Second, it was found that shorter nanosecond laser pulses are beneficial for a high ablation efficiency. NPs trapped in a stationary liquid layer, which has so far not been considered, present an obstacle in high-yield LAL. Hence, effective measures to lower the local NP concentration just in front of the target are demanded.
References
[61] Koechner W. Solid-State Laser Engineering Vol. 1 (Springer Series in Optical Sciences, New York, 2006).
[86] Harris DM, Pucci G, Prost V, Quintela Casal J, Bush JWM. Video: The merger of a bubble and a soap film. In 68th Annual Meeting of the APS Division of Fluid Dynamics - Gallery of Fluid Motion (American Physical Society, 2015).
[90] Jakubith M. Grundoperationen Und Chemische Reaktionstechnik: Eine Einführung in Die Technische Chemie (Wiley-VCH, Weinheim, 1998).