
Mei Li, Tianbiao Liu, Yonggang Wang, Wenge Yang, Xujie Lü. Pressure responses of halide perovskites with various compositions, dimensionalities, and morphologies[J]. Matter and Radiation at Extremes, 2020, 5(1): 018201
- Matter and Radiation at Extremes
- Vol. 5, Issue 1, 018201 (2020)
![(a) Schematic diagram of perovskite structure. This figure is reproduced with permission from Yin et al., J. Mater. Chem. A 3, 8926–8942 (2015). Copyright 2015 The Royal Society of Chemistry.28 (b) Tolerance factors (t) for different organic–inorganic HPVs. This figure is reproduced with permission from Fan et al., J. Mater. Chem. A 3, 18809–18828 (2015). Copyright 2015 The Royal Society of Chemistry.21 (c) Crystal structures of 3D and 2D HPVs. This figure is taken from Ref. 27. (d) Crystal structures of the 2D HPV of L2An-1BnX3n+1 (from n = 1 to n = ∞) with different [BX6]4− octahedral layers. The number of inorganic layers n = ∞ corresponds to 3D HPV structure. (c) and (d) Reproduced with permission from Jaffe et al., ACS Energy Lett. 2, 1549–1555 (2017). Copyright 2017 American Chemical Society.27](/richHtml/MRE/2020/5/1/018201/img_1.jpg)
Fig. 1. (a) Schematic diagram of perovskite structure. This figure is reproduced with permission from Yin et al. , J. Mater. Chem. A 3 , 8926–8942 (2015). Copyright 2015 The Royal Society of Chemistry.28 (b) Tolerance factors (t ) for different organic–inorganic HPVs. This figure is reproduced with permission from Fan et al. , J. Mater. Chem. A 3 , 18809–18828 (2015). Copyright 2015 The Royal Society of Chemistry.21 (c) Crystal structures of 3D and 2D HPVs. This figure is taken from Ref. 27 . (d) Crystal structures of the 2D HPV of L2An -1Bn X3n +1 (from n = 1 to n = ∞) with different [BX6]4− octahedral layers. The number of inorganic layers n = ∞ corresponds to 3D HPV structure. (c) and (d) Reproduced with permission from Jaffe et al. , ACS Energy Lett. 2 , 1549–1555 (2017). Copyright 2017 American Chemical Society.27
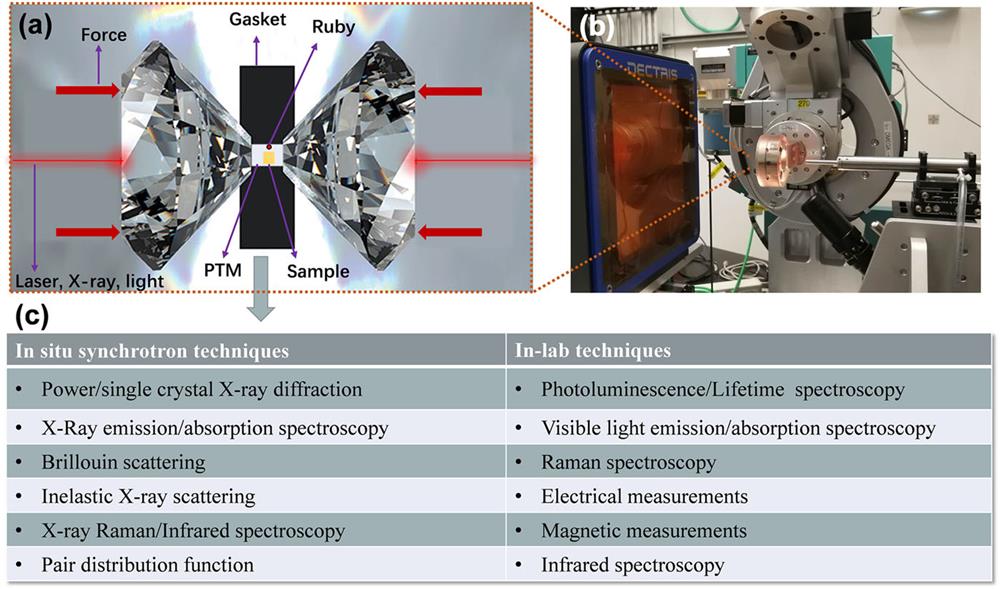
Fig. 2. (a) Schematic diagram of the sample in a DAC. (b) High-pressure synchrotron-based setup for diffraction. (c) In situ in-laboratory and synchrotron-based characterization tools under high pressures.
Fig. 3. The research progress of HPVs under high pressure. Reproduced with permission from Wu et al., J. Am. Chem. Soc. 137 , 2089–2096 (2015). Copyright 2015 The Royal Society of Chemistry;33 Wang et al., J. Am. Chem. Soc. 137 , 11144–11149 (2015). Copyright 2015 The Royal Society of Chemistry;54 Wang et al., J. Phys. Chem. Lett. 7 , 2556–2562 (2016). Copyright 2016 The Royal Society of Chemistry;86 Wang et al., J. Phys. Chem. Lett. 7 , 5273–5279 (2016). Copyright 2016 The Royal Society of Chemistry;87 Lu et al., Adv. Mater. 28 , 8663–8668 (2016). Copyright 2016 Wiley-VCH Verlag GmbH & Co. KGaA;37 Kong et al., Proc. Natl. Acad. Sci. 113 , 8910–8915 (2016);82 Zhang et al., J. Phys. Chem. Lett. 8 , 3752–3758 (2017). Copyright 2017 The Royal Society of Chemistry;84 Yan et al., J. Phys. Chem. Lett. 8 , 2944–2950 (2017). Copyright 2017 The Royal Society of Chemistry;70 Xiao et al., J. Am. Chem. Soc. 139 , 10087–10094 (2017). Copyright 2017 The Royal Society of Chemistry;43 Wang et al., Angew. Chem., Int. Ed. 56 , 15969–15973 (2017). Copyright 2017 Wiley-VCH Verlag GmbH & Co. KGaA;83 Zhu et al., Inorg. Chem. 57 , 6206–6209 (2018). Copyright 2018 The Royal Society of Chemistry;6 Ma et al., Nat. Commun. 9 , 4506 (2018). Copyright 2018 Springer Nature;11 Bischak et al., J. Phys. Chem. Lett. 9 , 3998–4005 (2018). Copyright 2018 The Royal Society of Chemistry;5 Ding et al., J. Mater. Chem. A 7 , 540–548 (2019). Copyright 2019 The Royal Society of Chemistry;20 Ren et al., J. Phys. Chem. C 123 , 15204–15208 (2019). Copyright 2019 The Royal Society of Chemistry;88 and Shi et al., J. Am. Chem. Soc. 141 , 6504–6508 (2019). Copyright 2019 The Royal Society of Chemistry.85
Fig. 4. (a) Summary of pressure-induced structural evolution in MAPb/SnX3. (b) Pressure-induced bandgap evolution of MAPbI3. (c) Pressure dependence of average carrier lifetimes of single crystal and polycrystalline MAPbI3; inset shows normalized results. (b) and (c) Reproduced with permission from Kong et al., Proc. Natl. Acad. Sci. 113 , 8910–8915 (2016).82 (d) Comparison of pressure-induced variations of the electronic structure of MA/FAPbX3. These include the bandgap (Eg), the pressure at the minimum bandgap (Egmin), and the bandgap decreased values (∆Eg). These figures are taken from Refs. 54 , 56 , 82 , 86 , 87 , and 94 . (e) Summary of several organic–inorganic HPV carrier lifetimes under high pressure.
Fig. 5. (a) Electrical resistance as a function of pressure for MAPbBr3. The inset in panel (a) shows microphotographs of the samples with four Au probes in two DACs. This figure is reproduced with permission from Wang et al. , J. Am. Chem. Soc. 137 , 11144–11149 (2015). Copyright 2015 American Chemical Society.54 (b) Electrical conductivity of MAPbI3 as a function of pressure. Inset shows the Arrhenius fit of the temperature-dependent conductivity at 51 GPa, which gives an activation energy Ea of 13.2(3) meV. This figure is taken from Ref. 91 . (c) XRD patterns of MASnI3 under cyclic pressurization and original XRD images at six selected pressures. (d) Pressure-induced evolution of electrical resistivity and comparison of resistivity before and after high-pressure treatment. (e) Photocurrent changes under pressure. The blue line indicates the first loop and the red line indicates the second loop. These figures are reproduced with permission from Lu et al. , Adv. Mater. 28 , 8663–8668 (2016). Copyright 2016 Wiley-VCH Verlag GmbH & Co. KGaA.37
Fig. 6. (a) WAXS patterns of CsPbBr3 nanocubes during compression and decompression. (b)–(d) Integrated WAXS spectra with calculated Bragg reflection positions at 1.4 GPa, 14.5 GPa, and total release of pressure, respectively. The bars represent the calculated Bragg reflection positions. (e) TEM image of the pressure-sintered NPLs. Inset shows the high-resolution (HR) TEM image of the pressurized sample with a lamellar structure before disassembly. (f) An HRTEM image and the corresponding FFT pattern (inset) of the pressure-synthesized CsPbBr3 NPLs. (g) Schematic demonstration of the pressure-sintering process: NC-SL evolution (top) and interparticle fusion (bottom). (h) Plots of the PL peak position of the NC-SL PLs (black) and the relative PL intensity (gray) as a function of pressure. The open square shows the PL intensity after decompression. These figures are reproduced with permission from Nagaoka et al. , Adv. Mater. 29 , 1606666 (2017). Copyright 2017 Wiley-VCH Verlag GmbH & Co. KGaA.98
Fig. 7. (a) and (b) In situ static PL and time-resolved PL spectra of (BA)2(MA)Pb2I7 under high pressure. (c) Pressure-induced evolution of bandgap of (BA)2(MA)Pb2I7 and three 3D HPVs. (d) Pressure dependence of the relative changes in the d -spacing. These figures are reproduced with permission from Liu et al. , ACS Energy Lett. 2 , 2518–2524 (2017). Copyright 2017 American Chemical Society.112 (e) Pressure-induced evolution of the electrical resistance of (C4H9NH3)2PbI4. This figure is taken from Ref. 113 .
Fig. 8. (a) Pressure-dependent PL spectra of 1D C4N2H14SnBr4. (b) PL images of C4N2H14SnBr4 under different pressures. (c) Pressure-dependent chromaticity coordinates. (d) and (e) Crystal structures and Br–Sn–Br bond length and angle of C4N2H14SnBr4 before and after the structural transition. (f) Calculation of the absorption oscillator strengths using the excited-state structure associated with STEs at 0.17 and 8.01 GPa. These figures are reproduced with permission from Shi et al. , J. Am. Chem. Soc. 141 , 6504–6508 (2019). Copyright 2019 American Chemical Society.85
Fig. 9. (a) and (b) UV-Vis absorption spectra of Cs2AgBiBr6 under high pressure. (c) Pressure-induced bandgap evolution of Cs2AgBiBr6, and representative optical micrographs. (d) Angle-dispersive synchrotron XRD patterns of Cs2AgBiBr6 at selected pressures. (e) and (f) Rietveld refinements of angle-dispersive synchrotron XRD patterns recorded at 0.6 and 4.5 GPa, respectively. These figures are reproduced with permission from Li et al. , Angew. Chem., Int. Ed. 56 , 15969–15973 (2017). Copyright 2017 Wiley-VCH Verlag GmbH & Co. KGaA.83
Fig. 10. High-pressure XRD patterns of (a) Cs2SnBr6 and (b) Cs2SnI6. (c) Two different crystal structures of Cs2SnI6, where the ambient pressure α -phase can be described as a body-centered tetragonal (BCT) unit cell with a lattice constant ratio c / a = 2 β -phase (I 2/m ) can be derived from the ambient BCT structure through the tilting of the SnI6 octahedra along the b axis. These figures are reproduced with permission from Bounos et al. , J. Phys. Chem. C 122 , 24004–24013 (2018). Copyright 2018 American Chemical Society.117 (d) Bandgap evolution of Cs3Sb2I9 at various pressures. The inset shows the bandgap Tauc plot of Cs3Sb2I9 at 1 atm. (e) Optical micrographs of Cs3Sb2I9 during compression. (f) The electrical resistance of Cs3Sb2I9 under high pressure. The inset shows the resistance-temperature diagram at different pressures. At 44.3 GPa, the electrical resistance of Cs3Sb2I9 increases with temperature ramping, suggesting the metallic behavior. These figures are reproduced with permission from Wu et al. , ChemSusChem 12 , 3971–3976 (2019). Copyright 2019 Wiley-VCH Verlag GmbH & Co. KGaA.118
|
Table 1. Pressure-driven evolution of structure and bandgap in bulk and nanostructured inorganic HPVs, including the pressure values of crystal structural transition Eg, the pressure values of phase transition ∆Eg, the pressure at the minimum bandgap Egmin, and the pressure at initial amorphization and the bulk modulus (K0/B0).

Set citation alerts for the article
Please enter your email address
© Copyright 2018-2021 | Chinese Laser Press. All Rights Reserved 沪ICP备15018463号-20