• Chinese Optics Letters
  • Vol. 16, Issue 4, 040701 (2018)
Yilun Xu1、2、3, Russell Wilcox1, John Byrd1, Lawrence Doolittle1, Qiang Du1, Gang Huang1, Yawei Yang1, Tong Zhou1, Lixin Yan2、3、*, Wenhui Huang2、3, and Chuanxiang Tang2、3
Author Affiliations
  • 1Accelerator Technology and Applied Physics Division, Lawrence Berkeley National Laboratory, Berkeley, CA 94720, USA
  • 2Department of Engineering Physics, Tsinghua University, Beijing 100084, China
  • 3Key Laboratory of Particle and Radiation Imaging, Ministry of Education, Tsinghua University, Beijing 100084, China
  • show less
    DOI: 10.3788/COL201816.040701 Cite this Article Set citation alerts
    Yilun Xu, Russell Wilcox, John Byrd, Lawrence Doolittle, Qiang Du, Gang Huang, Yawei Yang, Tong Zhou, Lixin Yan, Wenhui Huang, Chuanxiang Tang. Extracting cavity and pulse phases from limited data for coherent pulse stacking[J]. Chinese Optics Letters, 2018, 16(4): 040701 Copy Citation Text show less
    Physical model of pulse interference in the Z domain.
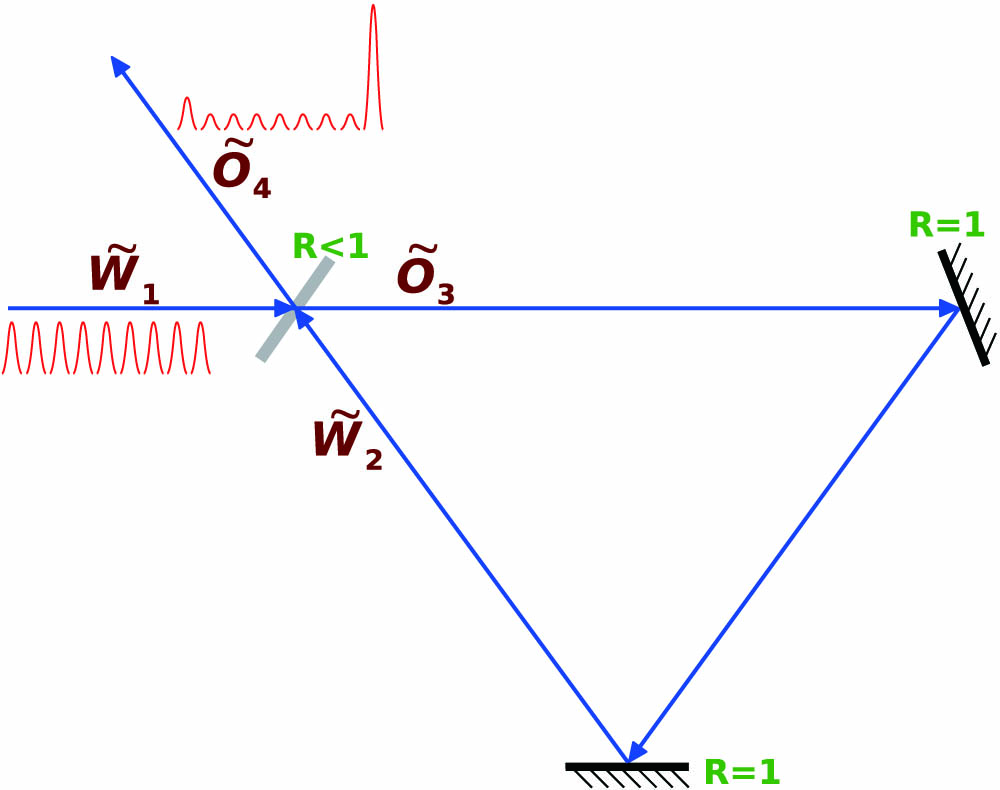
    Fig. 1. Physical model of pulse interference in the Z domain.
    Distance between cavity phase points.
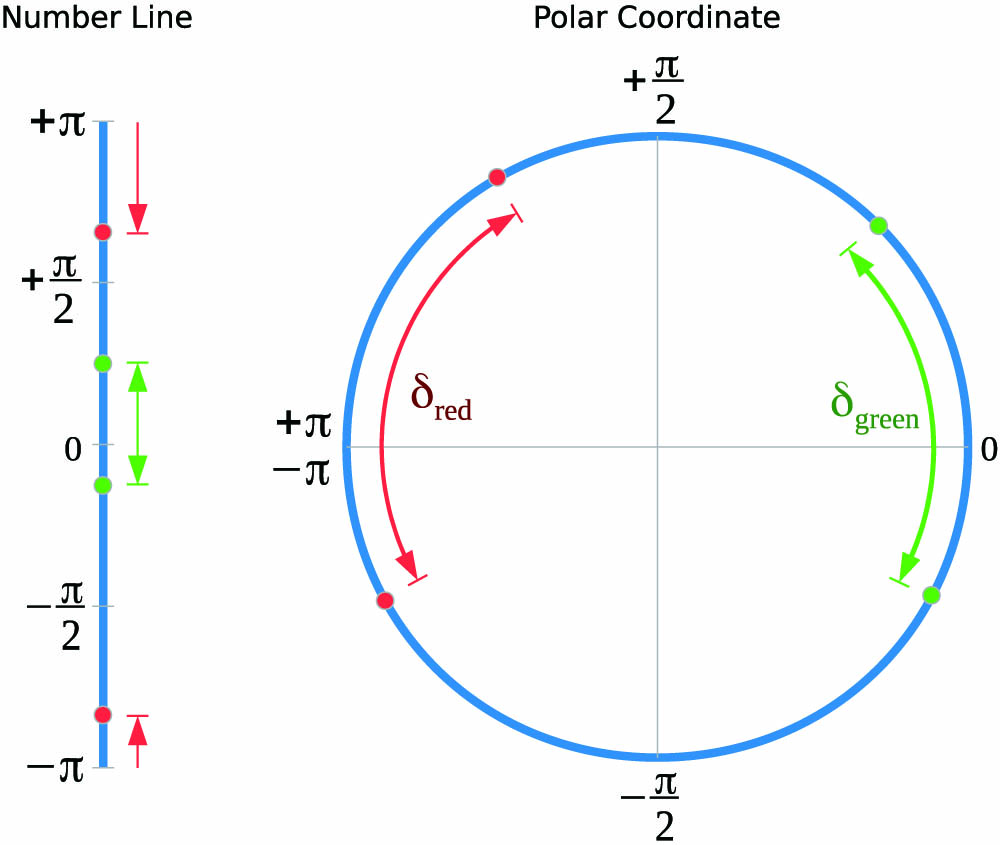
    Fig. 2. Distance between cavity phase points.
    (a) Four vectors (green or orange) are chosen randomly to extract the most likely cavity phase. The theoretical cavity phase (red) is 0 rad. (b) Histogram of all cavity phase candidates. The phase interval is 1.0°.
    Fig. 3. (a) Four vectors (green or orange) are chosen randomly to extract the most likely cavity phase. The theoretical cavity phase (red) is 0 rad. (b) Histogram of all cavity phase candidates. The phase interval is 1.0°.
    Simulation results. The probe pulse train consists of 41 pulses. The cavity phase calculation needs 40 iterations. (a) Pure system without noise. (b) Actual system with 1.0% power level noise.
    Fig. 4. Simulation results. The probe pulse train consists of 41 pulses. The cavity phase calculation needs 40 iterations. (a) Pure system without noise. (b) Actual system with 1.0% power level noise.
    Scanning the theoretical cavity phase over one cycle and extracting the most likely cavity phase accordingly. (a) Pure system without noise. (b) Actual system with 1.0% power level noise.
    Fig. 5. Scanning the theoretical cavity phase over one cycle and extracting the most likely cavity phase accordingly. (a) Pure system without noise. (b) Actual system with 1.0% power level noise.
    Errors of extracted cavity phases in a three-cavity system. (a) Cavity phase error is 0.7° (RMS) in the first cavity. (b) Cavity phase error is 0.8° (RMS) in the second cavity. (c) Cavity phase error is 0.9° (RMS) in the third cavity.
    Fig. 6. Errors of extracted cavity phases in a three-cavity system. (a) Cavity phase error is 0.7° (RMS) in the first cavity. (b) Cavity phase error is 0.8° (RMS) in the second cavity. (c) Cavity phase error is 0.9° (RMS) in the third cavity.
    Yilun Xu, Russell Wilcox, John Byrd, Lawrence Doolittle, Qiang Du, Gang Huang, Yawei Yang, Tong Zhou, Lixin Yan, Wenhui Huang, Chuanxiang Tang. Extracting cavity and pulse phases from limited data for coherent pulse stacking[J]. Chinese Optics Letters, 2018, 16(4): 040701
    Download Citation