
Ya Guo, Qiang Cai, Pu Li, Ruonan Zhang, Bingjie Xu, K. Alan Shore, Yuncai Wang. Ultrafast and real-time physical random bit extraction with all-optical quantization[J]. Advanced Photonics, 2022, 4(3): 035001
- Advanced Photonics
- Vol. 4, Issue 3, 035001 (2022)
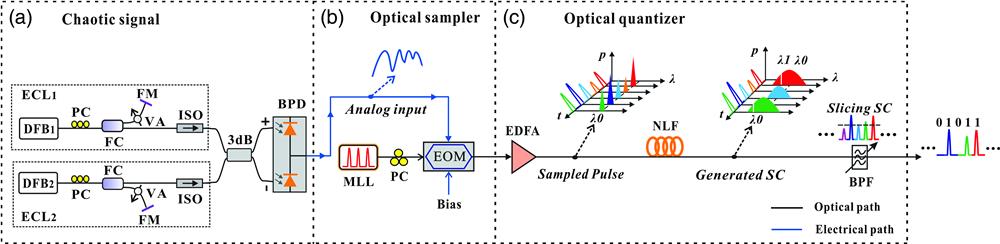
Fig. 1. Schematic of the proposed RBG with all-optical quantization: (a) optical chaos, (b) optical sampler, and (c) optical quantizer. DFB, distributed feedback semiconductor laser; PC, polarization controller; VA, variable optical attenuator; FM, fiber mirror; ISO, optical isolator; 3 dB, 3 dB FC; BPD, balanced photodiode; MLL, mode-locked laser; EOM, electro-optic modulator; EDFA, erbium-doped fiber amplifier; HNLF, highly nonlinear fiber; BPF, optical BPF.
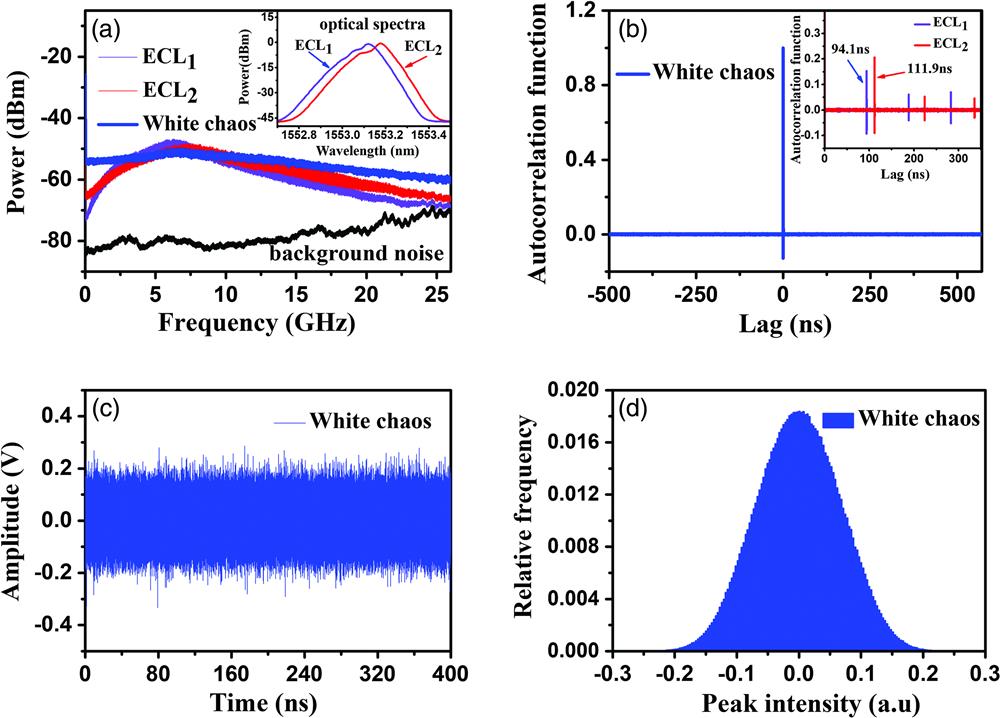
Fig. 2. (a) RF spectra of the white chaos and
Fig. 3. Schematic optical sampling results. (a) Continuous-time white chaotic waveform to be sampled; (b) discrete-time chaotic pulses after the optical sampler; (c) normalized CCF of the signal before and after the optical sampler.
Fig. 4. (a) Measured optical spectra from three SC pulses with different powers (45, 50, and 55 mW); (b) measured pulse waveform before (red) and after (blue) the threshold/quantization operation.
Fig. 5. (a) Bias
Fig. 6. NIST test results:
Fig. 7. Frequency of “1” in a random bit sequence (red squares) and the number of passed NIST tests (blue circles) as a function of the filtering center wavelength

Set citation alerts for the article
Please enter your email address
© Copyright 2018-2021 | Chinese Laser Press. All Rights Reserved 沪ICP备15018463号-20