
Mincheng Zhong, Ziqiang Wang, Yinmei Li, "Laser-accelerated self-assembly of colloidal particles at the water–air interface," Chin. Opt. Lett. 15, 051401 (2017)
- Chinese Optics Letters
- Vol. 15, Issue 5, 051401 (2017)
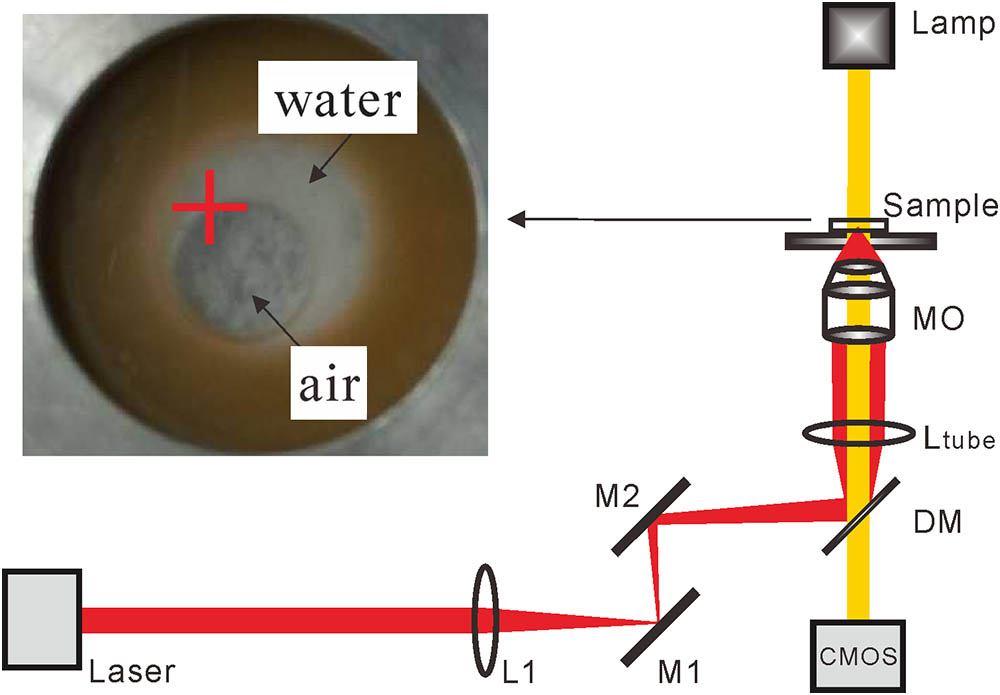
Fig. 1. Schematic of the experimental setup. L1, lens; M1-M2, mirrors; DM, dichroic mirror; L tube
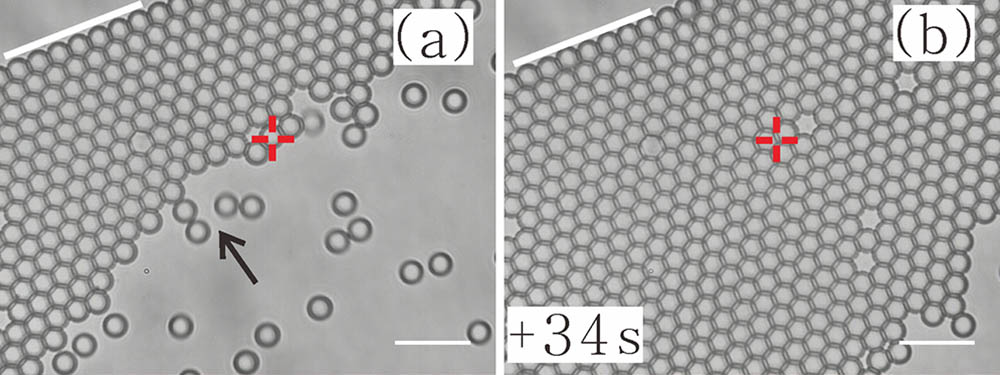
Fig. 2. Two-dimensional self-assembly accelerated at the water–air interface by optical tweezers. The NA of the objective is 1.25. The white lines mark the water–air interface at the upper left. The black arrow indicates the direction of the particles’ movement. Scale bar, 10 μm; ‘+’ indicates the optical trap center.
Fig. 3. Particles’ velocities dependence of laser power at the pupil of the objective lens. Error bars are the standard deviations of velocity. NA = 1.25
Fig. 4. Gap at the growing front is filled up by the incoming particles. The steep peak is created by optical tweezers. Scale bar, 10 μm; ‘+’ indicates the optical trap center.
Fig. 5. Smoothing process for a steep peak at the growing front. The particles at the peak are pulled down by the Marangoni flow, resulting in a reduction of the local roughness. Scale bar, 10 μm; ‘+’ indicates the optical trap center. The black arrows indicate the direction of the particles’ movement.
Fig. 6. Integration of particle aggregation into the crystal. (a) and (b) The aggregation is created by the optical tweezers. (c) and (d) The wide peak growing. Black lines mark the shape of the peak. Scale bar, 10 μm; ‘+’ indicates the optical trap center.
|
Table 1. Particles’ Velocities Dependence of NAs of Objectives with Error Barsa


Set citation alerts for the article
Please enter your email address

© Copyright 2018-2021 | Chinese Laser Press. All Rights Reserved 沪ICP备15018463号-20