• Chinese Optics Letters
  • Vol. 15, Issue 5, 051401 (2017)
Mincheng Zhong1、*, Ziqiang Wang2, and Yinmei Li2
Author Affiliations
  • 1School of Instrument Science and Opto-electronic Engineering, Hefei University of Technology, Hefei 230009, China
  • 2Department of Optics and Optical Engineering, University of Science and Technology of China, Hefei 230026, China
  • show less
    DOI: 10.3788/COL201715.051401 Cite this Article Set citation alerts
    Mincheng Zhong, Ziqiang Wang, Yinmei Li. Laser-accelerated self-assembly of colloidal particles at the water–air interface[J]. Chinese Optics Letters, 2017, 15(5): 051401 Copy Citation Text show less

    Abstract

    We experimentally demonstrate that optical tweezers can be used to accelerate the self-assembly of colloidal particles at a water–air interface in this Letter. The thermal flow induced by optical tweezers dominates the growth acceleration at the interface. Furthermore, optical tweezers are used to create a local growth peak at the growing front, which is used to study the preferential incorporation positions of incoming particles. The results show that the particles surfed with a strong Marangoni flow tend to fill the gap and smoothen the steep peaks. When the peak is smooth, the incoming particles incorporate the crystal homogeneously at the growing front.

    Colloidal crystals possess a large number of interesting and important properties, and, hence, find applications in photonic crystals[1], sensors[2,3], laser technology[4], and collective dynamics of microparticles[510]. There have been various methods developed to assemble two-dimensional colloidal crystals[1114]. Since the discovery of optical tweezers[15], optical forces have been widely studied[1619] and can be used for the assembly and reconfiguration of particles[2024]. The optical gradient forces drive the particles into the optical trap, and the particles will form a two-dimensional colloidal crystal. However, optical tweezers can only trap a few particles, so the colloidal crystals are always finite sized. Furthermore, the colloidal crystal will melt when the trapping laser is turned off[22].

    Besides the optical gradient force, there also exists a thermal gradient force when a laser beam is focused in the solutions[2527]. When the microparticles are far from the wall of the sample chamber, the thermal gradient force is relatively weak, and the optical force governs the motion of the microparticles. When the microparticles are suspended in a thin sample chamber with a laser absorbing metal coated surface, the thermal gradient will result in a strong convection[28]. Utilizing the thermal convection, the microparticles are accumulated and form two-dimensional crystals at the laser spot center[2932]. However, the particles that are accumulation driven by the thermophoresis depend on the type of particles. If the Soret coefficient of particles is negative, the particles will not be accumulated at the spot center, but will be depleted from the spot center.

    When close to the water–air interface, the microparticles move to the interface with small velocities and form an ordered cluster at the interface. In this Letter, we apply optical tweezers to accelerate the particles’ velocities and the growth rate of a two-dimensional crystal at the water–air interface. After the laser is turned off, the microparticles can be stably ordered with the confinement of the water layer. Moreover, the colloidal microparticles are used as big atoms to study the crystallization dynamics with the help of the optical tweezers.

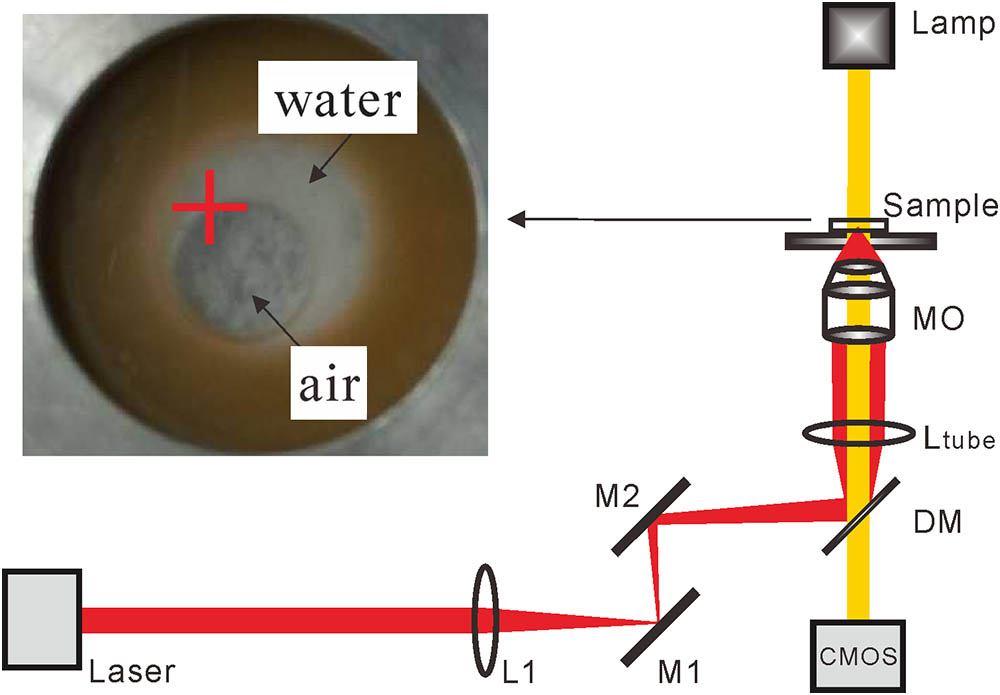
    Our optical tweezers setup is based on an inverted universal infinity microscope, as shown in Fig. 1. A linearly polarized continuous wave (CW) 1064 nm laser (Amonics, Hong Kong, AFL-1064-37-R-CL) is used as the trapping laser source. The laser beam is expanded by L1 and lens Ltube (Ltube is the tube lens inside the microscope) to fulfill the pupil of the microscope objective. The laser beam reflects upward by a dichroic mirror and focuses into the sample chamber after passing through a microscope objective. The images are recorded by a complementary metal-oxide-semiconductor (CMOS) camera (7 frames per second) and acquired by movie capture software.

    Schematic of the experimental setup. L1, lens; M1-M2, mirrors; DM, dichroic mirror; Ltube, tube lens; MO, microscope objective; CMOS, CMOS camera. Inset: top view of the circular trough. ‘+’ indicates the optical trap center.

    Figure 1.Schematic of the experimental setup. L1, lens; M1-M2, mirrors; DM, dichroic mirror; Ltube, tube lens; MO, microscope objective; CMOS, CMOS camera. Inset: top view of the circular trough. ‘+’ indicates the optical trap center.

    The samples are a diluted suspension of particles. The polystyrene microspheres are 3 μm diameter polymer particles (Duke Scientific, 4203 A, 1% volume concentration). The water–air interface is prepared using a homemade circular trough with an inner diameter of 10 mm and a height of 1 mm. At first, the trough is placed at a coverslip. A 60 μL suspension drop is injected into the trough, and then the trough is carefully sealed by the second coverslip. The sealed cell is placed vertically at first. The next step is to flatten the sample chamber, so the suspension wets the two coverslips and forms the water–air interface, as shown in the inset of Fig. 1. There is a thin water layer at the water–air interface. The sample chamber is placed at the microscopy stage for observation.

    The microparticles in the water solution are involved in the Brownian motion. Several minutes after the beginning of the experiment, the particle concentration in close vicinity to the coverslip surface becomes higher than in the bulk of the aqueous layer due to the sedimentation of the particles. The particles near the water–air interface are immersed in a liquid layer on the coverslip, and the deformations of the water–air interface give rise to strong and long-range interparticle capillary forces[33]. The attractive capillary forces and the convective flow induced by water evaporation drive the particles toward the ordered region slowly. When the particles arrive at the interface, they are ordered into domains with hexagonal packing. The microparticles’ array is about 14 mm in width in about 2 min, as shown in Fig. 2(a). When a laser is focused on the water layer at the water–air interface, the microparticles are quickly moving toward the interface. When the laser power is 140 mW at the pupil of the objective, a cluster with a width of 37 μm builds up within 34 s after the laser begins working, as shown in Fig. 2(b). We think that the Marangoni flow induced by the temperature gradient of the water accelerates the self-assembly of the colloidal crystal, so a cluster with width of 37 μm is obtained after 34 s.

    Two-dimensional self-assembly accelerated at the water–air interface by optical tweezers. The NA of the objective is 1.25. The white lines mark the water–air interface at the upper left. The black arrow indicates the direction of the particles’ movement. Scale bar, 10 μm; ‘+’ indicates the optical trap center.

    Figure 2.Two-dimensional self-assembly accelerated at the water–air interface by optical tweezers. The NA of the objective is 1.25. The white lines mark the water–air interface at the upper left. The black arrow indicates the direction of the particles’ movement. Scale bar, 10 μm; ‘+’ indicates the optical trap center.

    When the laser beam incidents on the water–air interface, light absorption happens. After absorption by the water enclosed in a cylindrical surface that intersects the light cone, the heating laser light transforms into heat power that propagates radially away from the light-cone axis. The temperature rise for a distance a, a can be given by[34]ΔT(a,a)=Pinαw2πKlnaa,where αw is the absorption coefficient of water, a is the radius of the illumination surface, a is the radius of the outside cylinder (a<a), K is the thermal conductivity of water, and Pin is the input laser power at the focal plane. It can be calculated that the radius of the illumination surface is a=0.61λ/NA=0.52μm, and the radius of outside cylinder is a=δ·tanθ=4.31μm, where δ is the thickness of the water layer and is approximately equal to the diameter of particles. We measure the transmittance of the objective. The result shows that the transmittance is 70% at a wavelength of 1064 nm, so Pin is 98 mW when the laser power is 140 mW at the pupil of the objective. By using a=0.52μm, a=4.13μm, Pin=98mW, αw=0.14cm1 (at λ=1064nm[35]), and K=0.6W/(m·K)[36] in Eq. (1), the temperature rise ΔT is 0.8 K, and the temperature gradient T is about ΔT/a=0.18K/μm.

    Due to the decreases of water surface tension with the increasing temperature, the focused laser beam in the water forms a stable temperature gradient. The temperature gradient induces a flow at the surface of the water layer. Furthermore, the surface tension gradient must be balanced by a shear stress in the water. The shear stress induces a Marangoni flow, which drives the particles moving toward the water–air interface. The particle velocity U can be estimated as[37]U=σT·T·Rμ,where σT is the gradient of the interface tension of water, R is the radius of particle, T is the temperature gradient imposed on the water, and μ is the dynamic viscosity. By using R=1.5μm, σT=0.14×10³N/m, and T=0.18K/μm in Eq. (2), the velocity U is about 0.4 m/s. The experimental velocities around 8 μm/s (see Fig. 3) can then be accounted for by supposing a very small asymmetry. We think such an asymmetry in the experimental system is mainly induced by the boundary conditions because the particle is confined by two very close surfaces.

    Besides the temperature rise, the laser pressure introduces liquid surface deformation at the water–air interface. The spatial and temporal profile of the CW laser beam is quite stable, so the induced surface deformation is quite stable and will not disturb the fluid flow in the water. The surface deformation generated by the pulsed laser will change periodically, which will disturb the fluid flow and affect the particle accumulation.

    Particles’ velocities dependence of laser power at the pupil of the objective lens. Error bars are the standard deviations of velocity. NA=1.25. The line is a linear fit to the whole data.

    Figure 3.Particles’ velocities dependence of laser power at the pupil of the objective lens. Error bars are the standard deviations of velocity. NA=1.25. The line is a linear fit to the whole data.

    We measured the microparticles’ velocities at different laser powers. The results are shown in Fig. 3. The symbols correspond to the average for at least the five particles’ velocity measurements for each power, whereas the error bars are the standard deviations of velocity. The particles’ velocities increase linearly with the laser power, which is consistent with the expected result based on the Eqs. (1) and (2).

    We also measured the particles’ velocity at the same power using objectives with different NAs. The laser power is 340 mW at the pupil of the objective lens. The results are shown in Table 1. The velocities are the average for at least the five measurements for each NA, whereas the error bars are the standard deviations of the velocities. It can be seen that the velocities decrease when the NAs of the objective decrease. The decreasing of the NAs means that the light illuminating diameter d is increased according to d=1.22λ/NA. For a same laser power, the increasing of the illuminating diameter will decrease the temperature gradient, which will decrease the particles’ velocities according to Eq. (2).

    NAVelocity (μm/s)
    0.45.08±0.62
    0.78.27±0.47
    1.2520.87±2.05

    Table 1. Particles’ Velocities Dependence of NAs of Objectives with Error Barsa

    We try to assemble two-dimensional colloidal crystals with other types of microparticles, and the experiments show that the types of particles have a great influence on the particles’ ordering. It is difficult to assemble two-dimensional crystals with metal particles. The density of the polystyrene microspheres (1.05 g/mL) is very close to the density of the water. Therefore, the polystyrene microparticles can arrive and assemble at the interface before they precipitate at the surface of the coverslip. The densities of the metal microparticles are much larger than that of water, so the metal particles precipitate to the surface of the coverslip quickly. The convection flow is difficult to transport the metal particles to the interface.

    The transport of particles is influenced by the buoyancy and gravity, so we think that the velocities of particles would not increase linearly as expected by Eq. (2) when their sizes become small. For nanoparticles, it will take more time to obtain the crystal with the same width due to their small sizes. Furthermore, the nanoparticles usually form a non-monolayer crystal at the interface because the thickness of the water layer is larger than their diameter.

    The optical tweezers can trap particles in the process of particle ordering. Here, optical tweezers are used to study colloidal crystal growth kinetics. In general, the diffusion microparticles are homogeneously transported to the growing front. In the process of growing two-dimensional crystals, the optical tweezers can initially trap some microparticles in the optical trap, even form a finite-sized aggregation and create a steep peak at the growing front. The results show that the incoming microparticles have a tendency to fill in low places to form a flat growing front. As shown in Fig. 4, the optical trap is close the growing front, and the trapped microparticles form a peak at first. However, the peak is finally flattened by the accumulation of incoming microparticles at the water–air interface.

    Gap at the growing front is filled up by the incoming particles. The steep peak is created by optical tweezers. Scale bar, 10 μm; ‘+’ indicates the optical trap center.

    Figure 4.Gap at the growing front is filled up by the incoming particles. The steep peak is created by optical tweezers. Scale bar, 10 μm; ‘+’ indicates the optical trap center.

    A flattening example occurring in Fig. 4 is detailed in Fig. 5. In this process, incoming particles 1 and 2 are transported from the solution to the peak, but eventually become incorporated at the bottom of the peak in Fig. 5(a). Figure 5 shows that particles 1 and 2 experience two motions in succession while approaching the bottom of the peak: first, the particles are attached at the top of peak; second, the Marangoni force eventually pulls particles 1 and 2 down to the lower layers, as shown in Fig. 5(c). The incoming particles become incorporated into the two-dimensional crystal at last.

    Smoothing process for a steep peak at the growing front. The particles at the peak are pulled down by the Marangoni flow, resulting in a reduction of the local roughness. Scale bar, 10 μm; ‘+’ indicates the optical trap center. The black arrows indicate the direction of the particles’ movement.

    Figure 5.Smoothing process for a steep peak at the growing front. The particles at the peak are pulled down by the Marangoni flow, resulting in a reduction of the local roughness. Scale bar, 10 μm; ‘+’ indicates the optical trap center. The black arrows indicate the direction of the particles’ movement.

    In the process of growing, the microparticles far away from the growing front can be transported to the interface. The formation of the flat growing front indicates that the Marangoni convection dominates the colloidal crystal growing. With the kinetic energy obtained from the Marangoni flow, the particles are brought into the bottom of the peak, these processes are helpful for reducing the roughness of the growth surface and promote the formation of a smooth crystal surface.

    When the peak is not steep and has a platform, the diffusion of particles is different, as shown in Fig. 6. When the optical trap is far away from the growing front, it can trap microparticles to form an aggregation. The aggregation forms a steep peak at first, as shown in Fig. 6(b). The incoming particles are pulled to fill the gap, and the steep peak becomes a wide peak at the growing front in Fig. 6(c). The top of the wide peak is wide and can keep the incoming particles, which incorporate the crystal homogeneously at all the growing fronts. The particles attach at the peak order at the top of the peak, but do not diffuse to bottom of the peak again. When more and more incoming microparticles are incorporated into the crystal, the peak is heightened and widened, as shown in Fig. 6(d). At last, the trapped aggregation also becomes part of the crystal.

    Integration of particle aggregation into the crystal. (a) and (b) The aggregation is created by the optical tweezers. (c) and (d) The wide peak growing. Black lines mark the shape of the peak. Scale bar, 10 μm; ‘+’ indicates the optical trap center.

    Figure 6.Integration of particle aggregation into the crystal. (a) and (b) The aggregation is created by the optical tweezers. (c) and (d) The wide peak growing. Black lines mark the shape of the peak. Scale bar, 10 μm; ‘+’ indicates the optical trap center.

    Colloidal crystals have usually been studied as a model system of atomic crystals[3840]. The advantage of utilizing colloidal particles as model is that the colloidal particles are much larger in size than real atoms and can be observed directly by optical microscopy. The natural crystallization processes of colloidal crystals have been studied in with single-particle resolution[4143]. In the process of crystal growth, it is an important role for the two-dimensional nucleation at the growing front and the diffusion of the grown unit. Here, optical tweezers are used to trap the particles and form artificially grown peaks in the growing front, which is used to study the colloidal crystal growing process. It is confirmed that the incoming particles have a tendency to fill the gap for reducing the local roughness under the convection flow.

    Now, it is difficult to obtain a large scale of colloidal crystals with this method. The main reason can be attributed to the neat two reasons: the first one is that the particles should be held by the water layer, and the width of the layer is limited; the second one is that the action range of the thermal gradient caused by optical tweezers is small. We think that the suitable electrolyte concentration in the solution is helpful to form steady patterns of microparticles[44,45], and then the order particles are no longer restricted by the water layer. Furthermore, multiple optical tweezers or optical tweezers with large power may help obtain larger-sized crystals.

    In conclusion, the thermal gradient induced by the optical tweezers at the water–air interface is used to accelerate the growing of the colloidal crystals in this Letter. The movement velocities of particles increase linearly with the laser power increasing. Moreover, optical tweezers are used to trap the particles during the growing process, which form growth peaks on the growing front. The experimental results show that the diffusion particles have a tendency to fill the gap for reducing the local roughness. When the created peak is steep, the incoming particles will fill the gap and form a flat front. For a wide top peak, the peak will be plumped with the accumulation of particles. The result in this Letter is valuable for producing two-dimensional colloidal crystals and to study the growing mechanism.

    References

    [1] J. D. Joannopoulos, P. R. Villeneuve, S. Fan. Nature, 386, 143(1997).

    [2] A. Stein, F. Li, N. R. Denny. Chem. Mater., 20, 649(2007).

    [3] J.-T. Zhang, L. Wang, J. Luo, A. Tikhonov, N. Kornienko, S. A. Asher. J. Am. Chem. Soc., 133, 9152(2011).

    [4] Z. Wang, Q. Li, Z. Wang, F. Zou, Y. Bai, S. Feng, J. Zhou. Chin. Opt. Lett., 14, 81401(2016).

    [5] J. Palacci, S. Sacanna, A. P. Steinberg, D. J. Pine, P. M. Chaikin. Science, 339, 936(2013).

    [6] A. P. Petroff, X.-L. Wu, A. Libchaber. Phys. Rev. Lett., 114, 158102(2015).

    [7] R. Singh, R. Adhikari. Phys. Rev. Lett., 117, 228002(2016).

    [8] H. Zhang, M. Liu, F. Zhou, D. Liu, G. Liu, G. Duan, W. Cai, Y. Li. Small, 11, 844(2015).

    [9] D. Liu, C. Li, F. Zhou, T. Zhang, H. Zhang, X. Li, G. Duan, W. Cai, Y. Li. Sci. Rep., 5, 7686(2015).

    [10] Z. Dai, H. Dai, Y. Zhou, D. Liu, G. Duan, W. Cai, Y. Li. Adv. Mater. Interfaces, 2, 1500167(2015).

    [11] P. Jiang, T. Prasad, M. J. McFarland, V. L. Colvin. Appl. Phys. Lett., 89, 011908(2006).

    [12] J. T. Zhang, L. Wang, D. N. Lamont, S. S. Velankar, S. A. Asher. Angew. Chem. Int. Ed., 51, 6117(2012).

    [13] X. Ye, L. Qi. Sci. China Chem., 57, 58(2014).

    [14] X. Li, J. Weng, Y. Guan, Y. Zhang. Langmuir, 32, 3977(2016).

    [15] A. Ashkin, J. M. Dziedzic, J. E. Bjorkholm, S. Chu. Opt. Lett., 11, 288(1986).

    [16] J. H. Zhou, M. C. Zhong, Z. Q. Wang, Y. M. Li. Opt. Express, 20, 14928(2012).

    [17] M. Zhong, X. Wang, J. Zhou, Z. Wang, Y. Li. Chin. Opt. Lett., 12, 011403(2014).

    [18] J. Huang, X. Liu, Y. Zhang, B. Li. Photon. Res., 3, 308(2015).

    [19] J. Liu, C. Zhang, Y. Zong, H. Guo, Z.-Y. Li. Photon. Res., 3, 265(2015).

    [20] C. A. Mejia, A. Dutt, M. L. Povinelli. Opt. Express, 19, 11422(2011).

    [21] E. Jaquay, L. J. Martínez, C. A. Mejia, M. L. Povinelli. Nano Lett., 13, 2290(2013).

    [22] S. Tanaka, Y. Oki, Y. Kimura. Phys. Rev. E, 89, 052305(2014).

    [23] S.-F. Wang, K.-I. Yuyama, T. Sugiyama, H. Masuhara. J. Phys. Chem. C, 120, 15578(2015).

    [24] T. Kudo, S. F. Wang, K. Yuyama, H. Masuhara. Nano Lett., 16, 3058(2016).

    [25] Y. Liu, A. W. Poon. Opt. Express, 18, 18483(2010).

    [26] R. T. Schermer, C. C. Olson, J. P. Coleman, F. Bucholtz. Opt. Express, 19, 10571(2011).

    [27] P. Kumari, J. A. Dharmadhikari, A. K. Dharmadhikari, H. Basu, S. Sharma, D. Mathur. Opt. Express, 20, 4645(2012).

    [28] R. Piazza. Soft Matter, 4, 1740(2008).

    [29] S. Duhr, D. Braun. Appl. Phys. Lett., 86, 131921(2005).

    [30] F. M. Weinert, D. Braun. Phys. Rev. Lett., 101, 168301(2008).

    [31] R. Di Leonardo, F. Ianni, G. Ruocco. Langmuir, 25, 4247(2009).

    [32] J. Chen, H. Cong, F. C. Loo, Z. Kang, M. Tang, H. Zhang, S. Y. Wu, S. K. Kong, H. P. Ho. Sci. Rep., 6, 35814(2016).

    [33] N. Denkov, O. Velev, P. Kralchevski, I. Ivanov, H. Yoshimura, K. Nagayama. Langmuir, 8, 3183(1992).

    [34] H. B. Mao, J. R. Arias-Gonzalez, S. B. Smith, I. Tinoco, C. Bustamante. Biophys. J., 89, 1308(2005).

    [35] R. Fischer, A. Ting, G. DiComo, J. Prosser, J. Peñano, B. Hafizi, P. Sprangle. Appl. Opt., 48, 6990(2009).

    [36] D. R. Lide. CRC Handbook of Chemistry and Physics(2001).

    [37] Z. Yin, P. Gao, W. Hu, L. Chang. Phys. Fluids, 20, 082101(2008).

    [38] V. J. Anderson, H. N. Lekkerkerker. Nature, 416, 811(2002).

    [39] W. Poon. Science, 304, 830(2004).

    [40] T.-H. Zhang, J.-S. Cao, Y. Liang, X.-Y. Liu. Acta Phys. Sin., 65, 176401(2016).

    [41] W. K. Kegel, A. van Blaaderen. Science, 287, 290(2000).

    [42] U. Gasser, E. R. Weeks, A. Schofield, P. N. Pusey, D. A. Weitz. Science, 292, 258(2001).

    [43] T. H. Zhang, X. Y. Liu. J. Phys. Chem. C, 111, 1342(2007).

    [44] S. H. Xu, Y. M. Li, L. R. Lou, H. T. Chen, Z. W. Sun. Jan. J. Appl. Phys., 41, 166(2002).

    [45] Z. Sun, S. Xu, G. Dai, Y. Li, L. Lou, Q. Liu, R. Zhu. J. Chem. Phys., 119, 2399(2003).

    Mincheng Zhong, Ziqiang Wang, Yinmei Li. Laser-accelerated self-assembly of colloidal particles at the water–air interface[J]. Chinese Optics Letters, 2017, 15(5): 051401
    Download Citation