• Photonics Research
  • Vol. 10, Issue 2, 332 (2022)
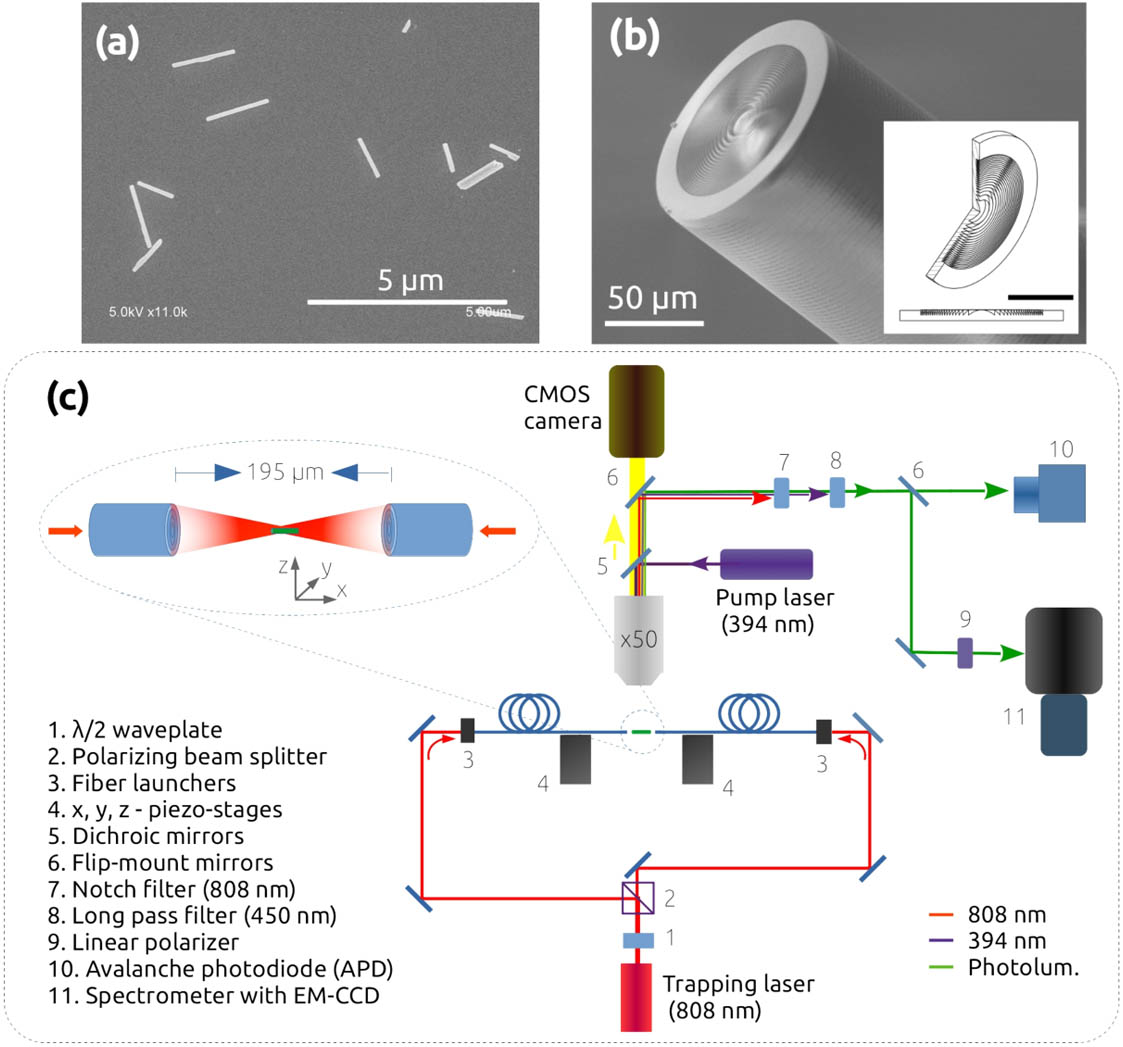
Aashutosh Kumar1, Asa Asadollahbaik2, Jeongmo Kim3, Khalid Lahlil3, Simon Thiele4, Alois M. Herkommer4, Síle Nic Chormaic1、5, Jongwook Kim3, Thierry Gacoin3, Harald Giessen2, and Jochen Fick1、*
Author Affiliations
  • 1Université Grenoble Alpes, CNRS, Institut Néel, 38000 Grenoble, France
  • 24th Physics Institute and Research Center SCoPE, University of Stuttgart, 70569 Stuttgart, Germany
  • 3Université Paris Saclay, CNRS, Laboratoire de Physique de la Matière Condensée, École Polytechnique, 91128 Palaiseau, France
  • 4Institute of Applied Optics and Research Center SCoPE, University of Stuttgart, 70569 Stuttgart, Germany
  • 5Okinawa Institute of Science and Technology Graduate University, Okinawa 904-0495, Japan
  • show less
    DOI: 10.1364/PRJ.434645 Cite this Article Set citation alerts
    Aashutosh Kumar, Asa Asadollahbaik, Jeongmo Kim, Khalid Lahlil, Simon Thiele, Alois M. Herkommer, Síle Nic Chormaic, Jongwook Kim, Thierry Gacoin, Harald Giessen, Jochen Fick. Emission spectroscopy of NaYF4:Eu nanorods optically trapped by Fresnel lens fibers[J]. Photonics Research, 2022, 10(2): 332 Copy Citation Text show less
    (a) SEM image of NaYF4:Eu3+ nanorods. (b) SEM image and CAD drawing of the Fresnel lens fiber. (c) Schematic of the optical fiber tweezers setup.
    Fig. 1. (a) SEM image of NaYF4:Eu3+ nanorods. (b) SEM image and CAD drawing of the Fresnel lens fiber. (c) Schematic of the optical fiber tweezers setup.
    Optical trapping results. (a) PL intensity as a function of the number of nanorods in the trapped cluster. Inset: microscope photoluminescence image of a trapped nanorod. (b) Particle tracking plot for one single nanorod and clusters of two or three rods (P=32.2 mW). (c) Corresponding position (transverse and axial) and angular distributions. Inset: angular distribution width.
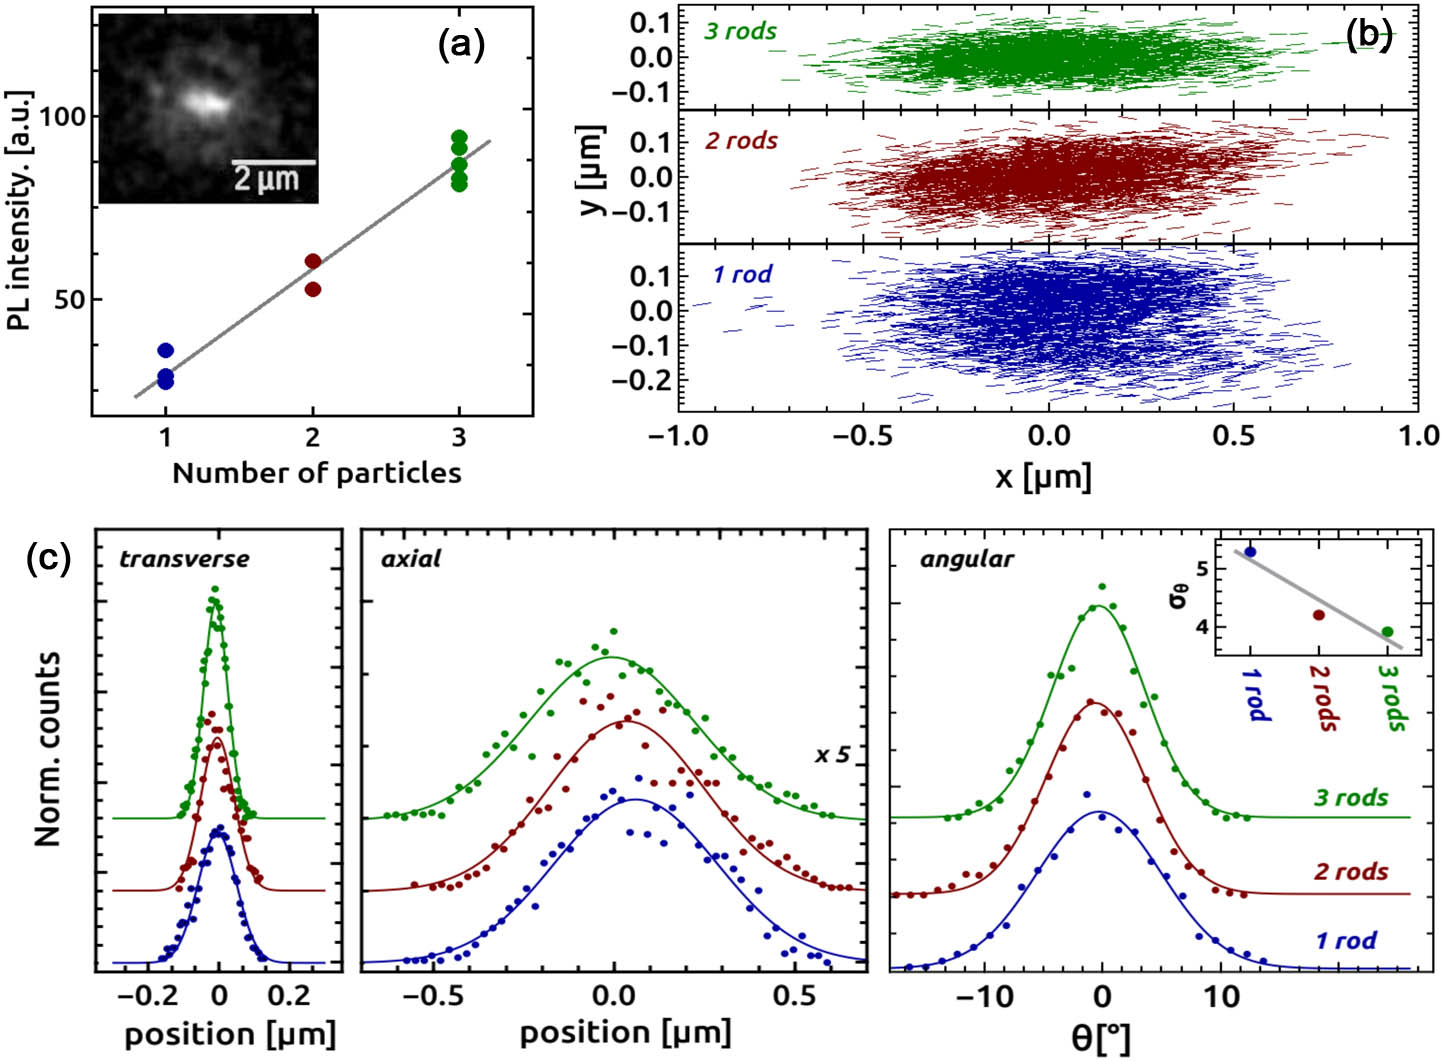
    Fig. 2. Optical trapping results. (a) PL intensity as a function of the number of nanorods in the trapped cluster. Inset: microscope photoluminescence image of a trapped nanorod. (b) Particle tracking plot for one single nanorod and clusters of two or three rods (P=32.2  mW). (c) Corresponding position (transverse and axial) and angular distributions. Inset: angular distribution width.
    Power spectrum analysis in axial and transverse directions for trapping of (a) one single rod and (b) a three-rod cluster. Lines are best fits to Eq. (2) (in the transverse direction, the fitting range is limited to frequencies f>2.5 Hz).
    Fig. 3. Power spectrum analysis in axial and transverse directions for trapping of (a) one single rod and (b) a three-rod cluster. Lines are best fits to Eq. (2) (in the transverse direction, the fitting range is limited to frequencies f>2.5  Hz).
    Power dependent trap stiffness κ in the (a) transverse and (b) axial directions. The lines are linear fits through the origin to calculate the normalized trapping stiffness κ˜ shown in the insets as a function of number of nanorods in the trapped cluster (lines are guides to the eye; BS, Boltzmann statistics; PSA, power spectrum analysis).
    Fig. 4. Power dependent trap stiffness κ in the (a) transverse and (b) axial directions. The lines are linear fits through the origin to calculate the normalized trapping stiffness κ˜ shown in the insets as a function of number of nanorods in the trapped cluster (lines are guides to the eye; BS, Boltzmann statistics; PSA, power spectrum analysis).
    (a) Emission spectra of optically trapped nanorods NaYF4:Eu3+ for σ and π orientations. Inset: comparison with the emission of nanorod clusters on a glass substrate. (b) Eu3+ energy level diagram.
    Fig. 5. (a) Emission spectra of optically trapped nanorods NaYF4:Eu3+ for σ and π orientations. Inset: comparison with the emission of nanorod clusters on a glass substrate. (b) Eu3+ energy level diagram.
    Europium emission polarization properties. (a)–(c) Gaussian peak distribution applied for fitting the respective emission lines, (d)–(f) polar emission amplitude plots, and (g)–(j) schemes showing the respective electric and magnetic dipole orientations and main emission polarizations. The lines in the polar plots are best numerical fits to Eq. (4).
    Fig. 6. Europium emission polarization properties. (a)–(c) Gaussian peak distribution applied for fitting the respective emission lines, (d)–(f) polar emission amplitude plots, and (g)–(j) schemes showing the respective electric and magnetic dipole orientations and main emission polarizations. The lines in the polar plots are best numerical fits to Eq. (4).
    (a) Photoluminescence (PL) decay for trapped nanorods at different pump powers. The lines are single exponential fits. (b) Pumper power dependent decay time. (c) PL decay for trapped nanorods and a nanorods cluster on a glass substrate.
    Fig. 7. (a) Photoluminescence (PL) decay for trapped nanorods at different pump powers. The lines are single exponential fits. (b) Pumper power dependent decay time. (c) PL decay for trapped nanorods and a nanorods cluster on a glass substrate.
     κ˜ [pN·μm1·W1]
     BSPSA
    Trans.AxialRatioTrans.AxialRatioσθ
    1 rod12.21.74748.35.2°
    2 rods35.02.55134.2°
    3 rods89.32.81321063.76283.9°
    Table 1. Transverse and Axial Normalized Trap Stiffness κ˜ Obtained by Boltzmann Statistics (BS) and Power Spectrum Analysis (PSA) and Angular Orientation Width σθ for One, Two, and Three Rods Trapped at P=32.2  mW
    PeakOri.λ [nm]σ [nm]ABφα
    MD5901π588.51.320.2030.3990.3°63.2°
    MD5902π589.90.850.0270.4863.2°80.5°
    MD5903σ592.01.270.6420.1793.7°36.8°
    ED6151610.00.450.3690.262–43.7°
    ED6152σ614.11.530.4390.122–0.3°69.6°
    ED6153π617.81.200.2920.416–0.2°49.8°
    ED6951σ689.11.620.4850.3022.7°80.0°
    ED6952π694.92.050.2710.458–3.3°47.4°
    ED6953π699.51.150.1310.7372.3°30.8°
    ED6954702.60.880.3750.24932.6°
    Table 2. Main Polar Fitting Parameters for Europium Emission Lines as Shown in Fig. 6a
    Aashutosh Kumar, Asa Asadollahbaik, Jeongmo Kim, Khalid Lahlil, Simon Thiele, Alois M. Herkommer, Síle Nic Chormaic, Jongwook Kim, Thierry Gacoin, Harald Giessen, Jochen Fick. Emission spectroscopy of NaYF4:Eu nanorods optically trapped by Fresnel lens fibers[J]. Photonics Research, 2022, 10(2): 332
    Download Citation