
Aashutosh Kumar, Asa Asadollahbaik, Jeongmo Kim, Khalid Lahlil, Simon Thiele, Alois M. Herkommer, Síle Nic Chormaic, Jongwook Kim, Thierry Gacoin, Harald Giessen, Jochen Fick, "Emission spectroscopy of NaYF4:Eu nanorods optically trapped by Fresnel lens fibers," Photonics Res. 10, 332 (2022)
- Photonics Research
- Vol. 10, Issue 2, 332 (2022)
Abstract
1. INTRODUCTION
Optical tweezers have become standard tools in many interdisciplinary research domains due to the possibility of manipulating, sorting, separating, and trapping micro- and nanometer sized objects. Already in 1993, shortly after the development of the original approach in 1986 based on strong laser beam focusing using a high numerical aperture (NA) microscope objective [1], the first fiber-based optical tweezers were demonstrated [2]. Trapping was obtained by aligning the fibers of two pigtailed lasers using just a cover slip and a capillary. This first work already highlights the great simplicity and small footprint of optical fiber tweezers. It has already been demonstrated that trapping of small particles at low light power is possible using microstructured fibers [3–5]. Chemical etching [6–10] and mechanical grinding [11] are the most popular techniques to realize fiber tips used for trapping in single or dual fiber geometries. More complex methods such as focused ion beam etching [12–14] and self-guided photopolymerization [15] are also applied to realize beam shaping devices at the distal ends of optical fibers. Finally, 3D printing of diffracting elements presents a versatile technique for beam shaping [16] and imaging purposes [17]. Fresnel lenses obtained by this technique have recently been applied for very efficient optical trapping of 1 μm and 500 nm polystyrene beads [18].
A major motivation for the development of optical tweezers is the possibility to combine trapping experiments with other experimental tools such as optical spectroscopy [19–22]. As an example, one can cite the use of Raman tweezers for the identification of nanoplastics in seawater [23]. Moreover, photoluminescent nanoparticle trapping is of great interest due to potential applications in bio-imaging experiments [24]. For example,
Optical trapping and manipulation require recording the position of trapped particles by optical microscopy. Photoluminescence (PL) imaging allows for determination of the nanoparticle position, whereas in the case of nanorods with hexagonal crystal structure, the emission anisotropy is used to determine the nanorod orientation [30,33,34]. Nanorods with high aspect ratios tend to form clusters that cannot be resolved optically. Measuring the PL emission power [33] or the trap stiffness [35] allows us, however, to estimate the number of nanorods in a cluster.
Sign up for Photonics Research TOC. Get the latest issue of Photonics Research delivered right to you!Sign up now
In this paper, we report on optical trapping of
2. MATERIALS AND METHODS
A. Nanorod Synthesis
The
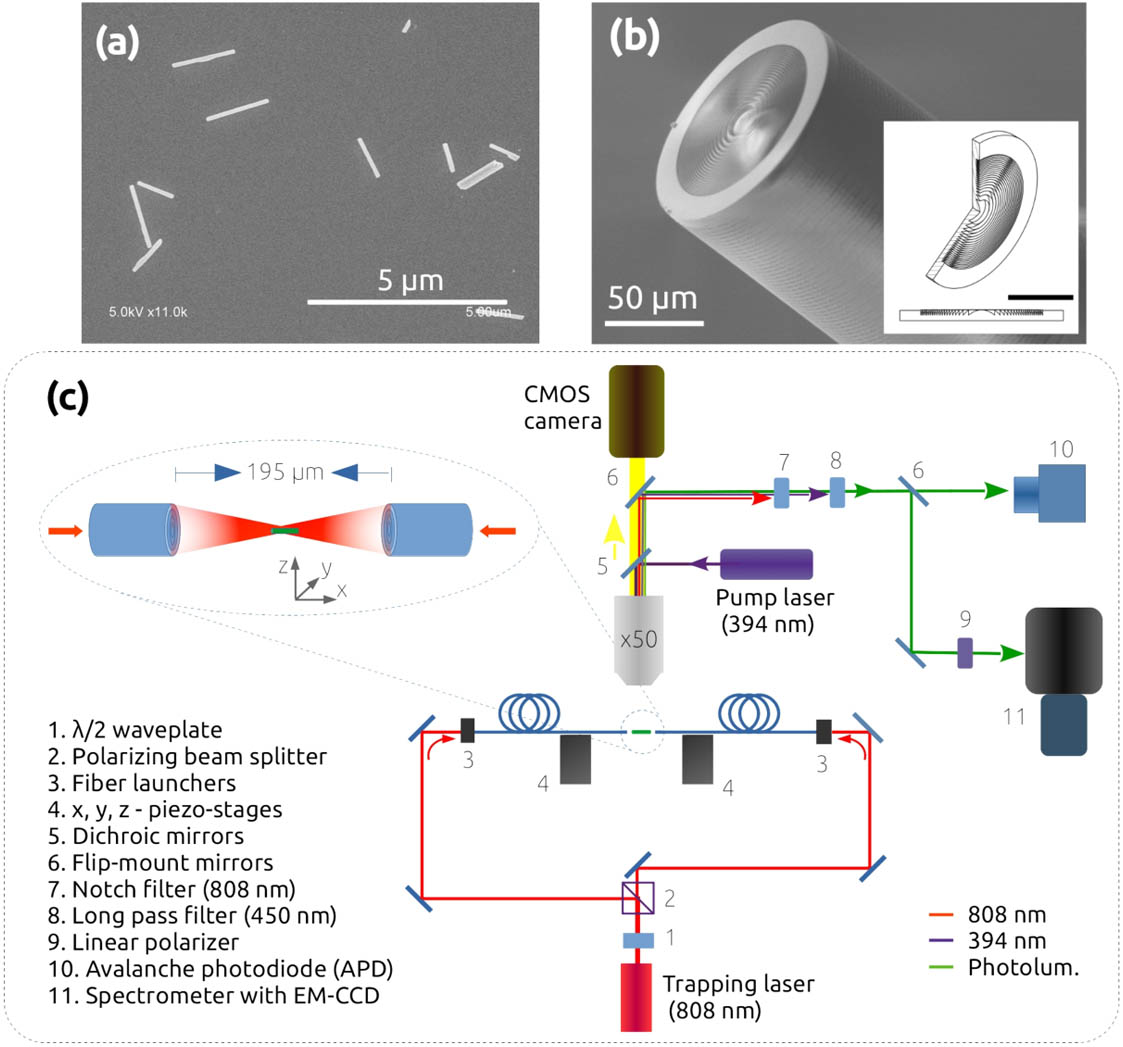
Figure 1.(a) SEM image of
B. Fresnel Lens Fiber Fabrication
A detailed description of the Fresnel lens fiber design and fabrication is given in Ref. [18]. The lenses are printed on standard, commercial single mode fibers (Nufern 780-HP) by femtosecond two photon lithography (Nanoscribe Photonic Professional GT) with commercial resist (Nanoscribe IP-Dip) [38]. The total writing time is 55 min for the lenses used in this work. To achieve a reasonable working distance at high NA, the optical fiber mode is expanded by propagation through a solid cylinder of 500 μm length [Fig. 1(b)]. The diffracting lens is modeled via a phase-function and geometrical ray-tracing based on the local grating approximation. The Fresnel lens fibers with
C. Optical Trapping Setup
The schema of the optical fiber tweezers is displayed in Fig. 1(c). The 808 nm trapping laser (LU0808M250, Lumics) is separated into two equal arms using a polarizing beam splitter and a half-wave plate to control the relative light intensities in each arm. The light beam is coupled into the optical fibers using fiber launchers. The output power from each fiber is directly measured at its distal end in air, before and after each experiment. The power values given in this paper correspond to the emitted power of one fiber in air. The fibers are mounted on two sets of
A homemade microscope, consisting of a long working distance microscope objective (Mitutoyo G Plan Apo
The recorded trapping videos are analyzed using a custom-written particle tracking algorithm, developed in the Scilab environment. This algorithm is based on two-dimensional Gaussian fitting of the ellipsoidal trapped nanorod PL image. It takes into account the time dependent particle orientation in the observation plane. Two complementary methods are applied to deduce the trap stiffness
For the spectroscopic measurements, the trapped nanorods’ PL is collected through the microscope objective by introducing a mirror on a flip-mount. The emission is then directed onto either a spectrometer coupled to an EM-CCD camera (Princeton Instruments ProEM) or an avalanche photodiode (APD, Thorlabs APD440A) for lifetime measurements. A set of optical filters suppresses the trapping and pumping wavelengths. Moreover, a linear polarizer in front of the spectrometer allows us to record polarization-resolved emission spectra. The zero of the polarizer angle
3. RESULTS
A. Nanorod Trapping
![]()
Figure 2.Optical trapping results. (a) PL intensity as a function of the number of nanorods in the trapped cluster. Inset: microscope photoluminescence image of a trapped nanorod. (b) Particle tracking plot for one single nanorod and clusters of two or three rods (
During trapping experiments, we concurrently observe untrapped nanorods that are attracted into the optical trap. When entering the trap, they form indistinguishable nanorod clusters with the rod(s) that is already trapped. In general, nanorods with high aspect ratios tend to form clusters of aligned nanorods that cannot be resolved by optical means. To get an estimation of the number of trapped particles, we measure the PL increase of the trapped cluster when a new nanorod joins [Fig. 2(a)]. The observed emission intensity steps are linearly increasing with the increasing number of nanorods in the clusters. It is thus possible to characterize the trapping properties as a function of the trapped cluster size.
Figure 2(b) shows the
![]()
Figure 3.Power spectrum analysis in axial and transverse directions for trapping of (a) one single rod and (b) a three-rod cluster. Lines are best fits to Eq. (
![]()
Figure 4.Power dependent trap stiffness
Depending on the number of nanorods in the trapped cluster, the trap stiffness is about 7 to 32 times higher in the transverse direction compared with the axial direction. This anisotropy increases significantly with the number of nanorods. In fact, the transverse trap stiffness for three rods is about 7.4 times higher than for a single rod, whereas the axial stiffness increase is limited to 1.6 times. Moreover, this dependency is quite different for the two directions (Fig. 4 insets). The increase is exponential in the transverse direction and exponentially converging towards a threshold in the axial direction.
The angular distribution width (
B. Photoluminescence of Optically Trapped Nanorods
The emission studies are performed on single nanorods and at a trapping power of 33.2 mW to ensure stable trapping with low angular dispersion. The emission spectrum exhibits three strong emission bands in the 570 nm to 710 nm spectral region [Fig. 5(a)]. One specific feature of the
![]()
Figure 5.(a) Emission spectra of optically trapped nanorods
Each of the three main transition bands can be divided into three to four emission peaks with either
The emission spectra of trapped nanorods are compared to the emission of a single cluster of 15 to 20 nanorods on a glass substrate [Fig. 5(a) inset]. The linewidths of the emission peaks in the 575–630 nm range are identical for trapped and dispersed nanorods. The
![]()
Figure 6.Europium emission polarization properties. (a)–(c) Gaussian peak distribution applied for fitting the respective emission lines, (d)–(f) polar emission amplitude plots, and (g)–(j) schemes showing the respective electric and magnetic dipole orientations and main emission polarizations. The lines in the polar plots are best numerical fits to Eq. (
The experimental emission intensities are fitted to the orthogonal polar function:
ED and MD moments
In the case of the MD transition, the two peaks
The
The
The lifetime of the europium
![]()
Figure 7.(a) Photoluminescence (PL) decay for trapped nanorods at different pump powers. The lines are single exponential fits. (b) Pumper power dependent decay time. (c) PL decay for trapped nanorods and a nanorods cluster on a glass substrate.
This PL decay of the trapped particles was compared to the already mentioned nanorod cluster on a glass slide. In this case, the decay is clearly a double exponential with short and long decay times of
4. DISCUSSION
Stable nanorod trapping is observed for fiber-to-fiber distances of about 200 μm and for light powers as low as 10 mW. As expected for dielectric nanorods, they align parallel to the beam/fiber axis, with a low angular distribution of
In general, BS and PSA are complementary methods with each having its own advantages and drawbacks. BS does not require one to know the Stokes’ friction coefficient. Slow mean trapping position shifts or two metastable trapping regions as observed for single rod trapping [Fig. 2(b)] result, however, in underestimated
The observed polarization features of the
In former work, we trapped
The PL decay of trapped nanorods is a single exponential with a decay time of 4.4 ms. For the particle cluster on the glass substrate, an additional, shorter decay with
5. CONCLUSION
Stable and reproducible trapping of europium-doped nanorods is studied in far-field, Fresnel lens dual fiber tweezers. High normalized trapping efficiencies
Polarization-resolved spectroscopy allows us to specify the
The presented results highlight the outstanding performance of our Fresnel lens fiber optical tweezers, permitting stable trapping of nanoparticles at low light power and large particle to fiber distance. The optical study of free, purely optically trapped, single nanoparticles is significantly facilitated. Moreover, the possibility to determine the nanorod orientation by fast spectroscopic means is of paramount interest for microrheologic experiments with anisotropic particles.
Acknowledgment
Acknowledgment. J.F acknowledges very fruitful discussions with G. Colas des Francs from ICB in Dijon, France. S.N.C. is grateful to Institut Néel for hosting her during the work. We thank also T. Pohl for his valuable help with graphics.
References
[1] A. Ashkin, J. M. Dziedzic, J. E. Bjorkholm, S. Chu. Observation of a single-beam gradient force optical trap for dielectric particles. Opt. Lett., 11, 288-290(1986).
[2] A. Constable, J. Kim, J. Mervis, F. Zarinetchi, M. Prentiss. Demonstration of a fiber-optical light-force trap. Opt. Lett., 18, 1867-1869(1993).
[3] J. S. Paiva, P. A. Jorge, C. C. Rosa, J. P. Cunha. Optical fiber tips for biological applications: from light confinement, biosensing to bioparticles manipulation. Biochim. Biophys. Acta, Gen. Sub., 1862, 1209-1246(2018).
[4] H. Lee, J. Park, K. Oh. Recent progress in all-fiber non-Gaussian optical beam shaping technologies. J. Lightwave Technol., 37, 2590-2597(2019).
[5] X. Zhao, N. Zhao, Y. Shi, H. Xin, B. Li. Optical fiber tweezers: a versatile tool for optical trapping and manipulation. Micromachines, 11, 114(2020).
[6] J.-B. Decombe, S. Huant, J. Fick. Single and dual fiber nano-tip optical tweezers: trapping and analysis. Opt. Express, 21, 30521-30531(2013).
[7] A. Barucci, F. Cosi, A. Giannetti, S. Pelli, D. Griffini, M. Insinna, S. Salvadori, B. Tiribilli, G. C. Righini. Optical fibre nanotips fabricated by a dynamic chemical etching for sensing applications. J. Appl. Phys., 117, 053104(2015).
[8] G. Leménager, K. Lahlil, T. Gacoin, G. Colas des Francs, J. Fick. Optical fiber tip tweezers, a complementary approach for nanoparticle trapping. J. Nanophoton., 13, 012505(2018).
[9] Z. Liu, N. Zhang, Y. Tang, Y. Liu, B. Zhang. An optical fibre tip with double tapers etched by the interfacial layer. J. Mod. Opt., 66, 168-175(2019).
[10] Y. X. Liu, B. Zhang, N. Zhang, Z. L. Liu. Fabricating fiber probes for optical tweezers by an improved tube etching method. Appl. Opt., 58, 7950-7956(2019).
[11] Z. Xie, V. Armbruster, T. Grosjean. Axicon on a gradient index lens (AXIGRIN): integrated optical bench for Bessel beam generation from a point-like source. Appl. Opt., 53, 6103-6107(2014).
[12] A. E. Eter, N. M. Hameed, F. I. Baida, R. Salut, C. Filiatre, D. Nedeljkovic, E. Atie, S. Bole, T. Grosjean. Fiber-integrated optical nano-tweezer based on a bowtie-aperture nano-antenna at the apex of a SNOM tip. Opt. Express, 22, 10072-10080(2014).
[13] R. S. Rodrigues Ribero, P. Dahal, A. Guerreiro, P. A. S. Jorge, J. Viegas. Fabrication of Fresnel plates on optical fibers by FIB milling for optical trapping; manipulation and detection of single cells. Sci. Rep., 7, 4485(2017).
[14] J. M. Ehtaiba, R. Gordon. Template-stripped nanoaperture tweezer integrated with optical fiber. Opt. Express, 26, 9607-9613(2018).
[15] R. S. Rodrigues Ribeiro, O. Soppera, A. G. Oliva, A. Guerreiro, P. A. S. Jorge. New trends on optical fiber tweezers. J. Lightwave Technol., 33, 3394-3405(2015).
[16] K. Weber, F. Hütt, S. Thiele, T. Gissibl, A. Herkommer, H. Giessen. Single mode fiber based delivery of OAM light by 3D direct laser writing. Opt. Express, 25, 19672-19679(2017).
[17] M. Schmid, F. Sterl, S. Thiele, A. Herkommer, H. Giessen. 3D printed hybrid refractive/diffractive achromat and apochromat for the visible wavelength range. Opt. Lett., 46, 2485-2488(2021).
[18] A. Asadollahbaik, S. Thiele, K. Weber, A. Kumar, J. Drozella, F. Sterl, A. Herkommer, H. Giessen, J. Fick. Highly efficient dual-fibre optical trapping with 3D printed diffractive Fresnel lenses. ACS Photon., 7, 88-97(2020).
[19] B. Agate, C. Brown, W. Sibbett, K. Dholakia. Femtosecond optical tweezers for
[20] C. Liberale, G. Cojoc, F. Bragheri, P. Minzioni, G. Perozziello, R. La Rocca, L. Ferrara, V. Rajamanickam, E. Di Fabrizio, I. Cristiani. Integrated microfluidic device for single-cell trapping and spectroscopy. Sci. Rep., 3, 1258(2013).
[21] L. Anbharasi, E. Bhanu Rekha, V. Rahul, B. Roy, M. Gunaseelan, S. Yamini, V. N. Adusumalli, D. Sarkar, V. Mahalingam, J. Senthilselvan. Tunable emission and optical trapping of upconverting LiYF4:Yb, Er nanocrystal. Opt. Laser Technol., 126, 106109(2020).
[22] S. Kumar, M. Gunaseelan, R. Vaippully, A. Banerjee, B. Roy. Breaking the diffraction limit in absorption spectroscopy using upconverting nanoparticles. Nanoscale, 13, 11856-11866(2021).
[23] R. Gillibert, G. Balakrishnan, Q. Deshoules, M. Tardivel, A. Magazzù, M. G. Donato, O. M. Maragò, M. Lamy de La Chapelle, F. Colas, F. Lagarde, P. G. Gucciardi. Raman tweezers for small microplastics and nanoplastics identification in seawater. Environ. Sci. Technol., 53, 9003-9013(2019).
[24] C. Song, S. Zhang, Q. Zhou, H. Hai, D. Zhao, Y. Hui. Upconversion nanoparticles for bioimaging. Nanotechnol. Rev., 6, 233-242(2017).
[25] A. Aebischer, M. Hostettler, J. Hauser, K. Krämer, T. Weber, H. U. Güdel, H.-B. Bürgi. Structural and spectroscopic characterization of active sites in a family of light-emitting sodium lanthanide tetrafluorides. Angew. Chem. Int. Ed., 45, 2802-2806(2006).
[26] C. Liu, Y. Hou, M. Gao. Are rare-earth nanoparticles suitable for in vivo applications?. Adv. Mater., 26, 6922-6932(2014).
[27] F. T. Rabouw, P. T. Prins, D. J. Norris. Europium-doped NaYF4 nanocrystals as probes for the electric and magnetic local density of optical states throughout the visible spectral range. Nano Lett., 16, 7254-7260(2016).
[28] D. Tu, Y. Liu, H. Zhu, R. Li, L. Liu, X. Chen. Breakdown of crystallographic site symmetry in lanthanide-doped NaYF4 crystals. Angew. Chem. Int. Ed., 52, 1128-1133(2013).
[29] R. Borja-Urby, L. Diaz-Torres, P. Salas, C. Angeles-Chavez, O. Meza. Strong broad green UV-excited photoluminescence in rare earth doped barium zirconate. Mater. Sci. Eng. B, 176, 1388-1392(2011).
[30] J. Kim, S. Michelin, M. Hilbers, L. Martinelli, E. Chaudan, G. Amselem, E. Fradet, J.-P. Boilot, A. M. Brouwer, C. N. Baroud, J. Peretti, T. Gacoin. Monitoring the orientation of rare-earth-doped nanorods for flow shear tomography. Nat. Nanotechnol., 12, 914-919(2017).
[31] A. Parchur, R. Ningthoujam. Behaviour of electric and magnetic dipole transitions of Eu3+, 5D0→7F0 and Eu-O charge transfer band in Li+ co-doped YPO4:Eu3+. RSC Adv., 2, 10859-10868(2012).
[32] R. Chacon, A. Leray, J. Kim, K. Lahlil, S. Mathew, A. Bouhelier, J.-W. Kim, T. Gacoin, G. Colas des Francs. Measuring the magnetic dipole transition of single nanorods by Fourier microscopy. Phys. Rev. Appl., 14, 054010(2020).
[33] P. Rodríguez-Sevilla, L. Labrador-Páez, D. Wawrzyncyk, M. Nyk, M. Samoc, A. Kumar Kar, M. Mackenzie, L. Paterson, D. Jacque, P. Haro-González. Determining the 3D orientation of optically trapped upconverting nanorods by
[34] J. Kim, R. Chacon, Z. Wang, E. Larquet, K. Lahlil, A. Leray, G. Colas des Francs, J. Kim, T. Gacoin. Measuring 3D orientation of nanocrystals via polarized luminescence of rare-earth dopants. Nat. Commun., 12, 1943(2021).
[35] P. J. Reece, W. J. Toe, F. Wang, S. Paiman, Q. Gao, H. H. Tan, C. Jagadish. Characterization of semiconductor nanowires using optical tweezers. Nano Lett., 11, 2375-2381(2011).
[36] G. Leménager, M. Thiriet, F. Pourcin, K. Lahlil, F. Valdivia-Valero, G. Colas des Francs, T. Gacoin, J. Fick. Size-dependent trapping behavior and optical emission study of NaYF4 nanorods in optical fiber tip tweezers. Opt. Express, 26, 32156-32167(2018).
[37] A. Kumar, J. Kim, K. Lahlil, G. Julie, S. N. Chormaic, J. Kim, T. Gacoin, J. Fick. Optical trapping and orientation-resolved spectroscopy of europium-doped nanorods. J. Phys. Photon., 2, 025007(2020).
[38] T. Gissibl, S. Wagner, J. Sykora, M. Schmid, H. Giessen. Refractive index measurements of photo-resists for three-dimensional direct laser writing. Opt. Mater. Express, 7, 2293-2298(2017).
[39] M. M. Tirado, J. Garcia de la Torre. Translational friction coefficients of rigid, symmetric top macromolecules. Application to circular cylinders. J. Chem. Phys., 71, 2581-2587(1979).


Set citation alerts for the article
Please enter your email address

© Copyright 2018-2021 | Chinese Laser Press. All Rights Reserved 沪ICP备15018463号-20