• High Power Laser Science and Engineering
  • Vol. 7, Issue 3, 03000e45 (2019)
D. R. Rusby1、†, C. D. Armstrong1, G. G. Scott1, M. King2, P. McKenna2, and D. Neely1、2
Author Affiliations
  • 1Central Laser Facility, STFC, Rutherford Appleton Laboratory, Chilton, DidcotOX11 0QX, UK
  • 2SUPA, Department of Physics, University of Strathclyde, Glasgow G4 0NG, UK
  • show less
    DOI: 10.1017/hpl.2019.34 Cite this Article Set citation alerts
    D. R. Rusby, C. D. Armstrong, G. G. Scott, M. King, P. McKenna, D. Neely. Effect of rear surface fields on hot, refluxing and escaping electron populations via numerical simulations[J]. High Power Laser Science and Engineering, 2019, 7(3): 03000e45 Copy Citation Text show less
    The electric field in the $x$ direction from the $1\times 10^{20}~\text{W}/\text{cm}^{2}$ simulation and the middle of the target as a function of time. We see that the fields peak at approximately 0.45 ps into the simulation. The dashed line represents the fast component of the field that is caused by the relativistic escaping electrons. The slower component, represented by the dotted line, is the field associated with the TSNA mechanism.
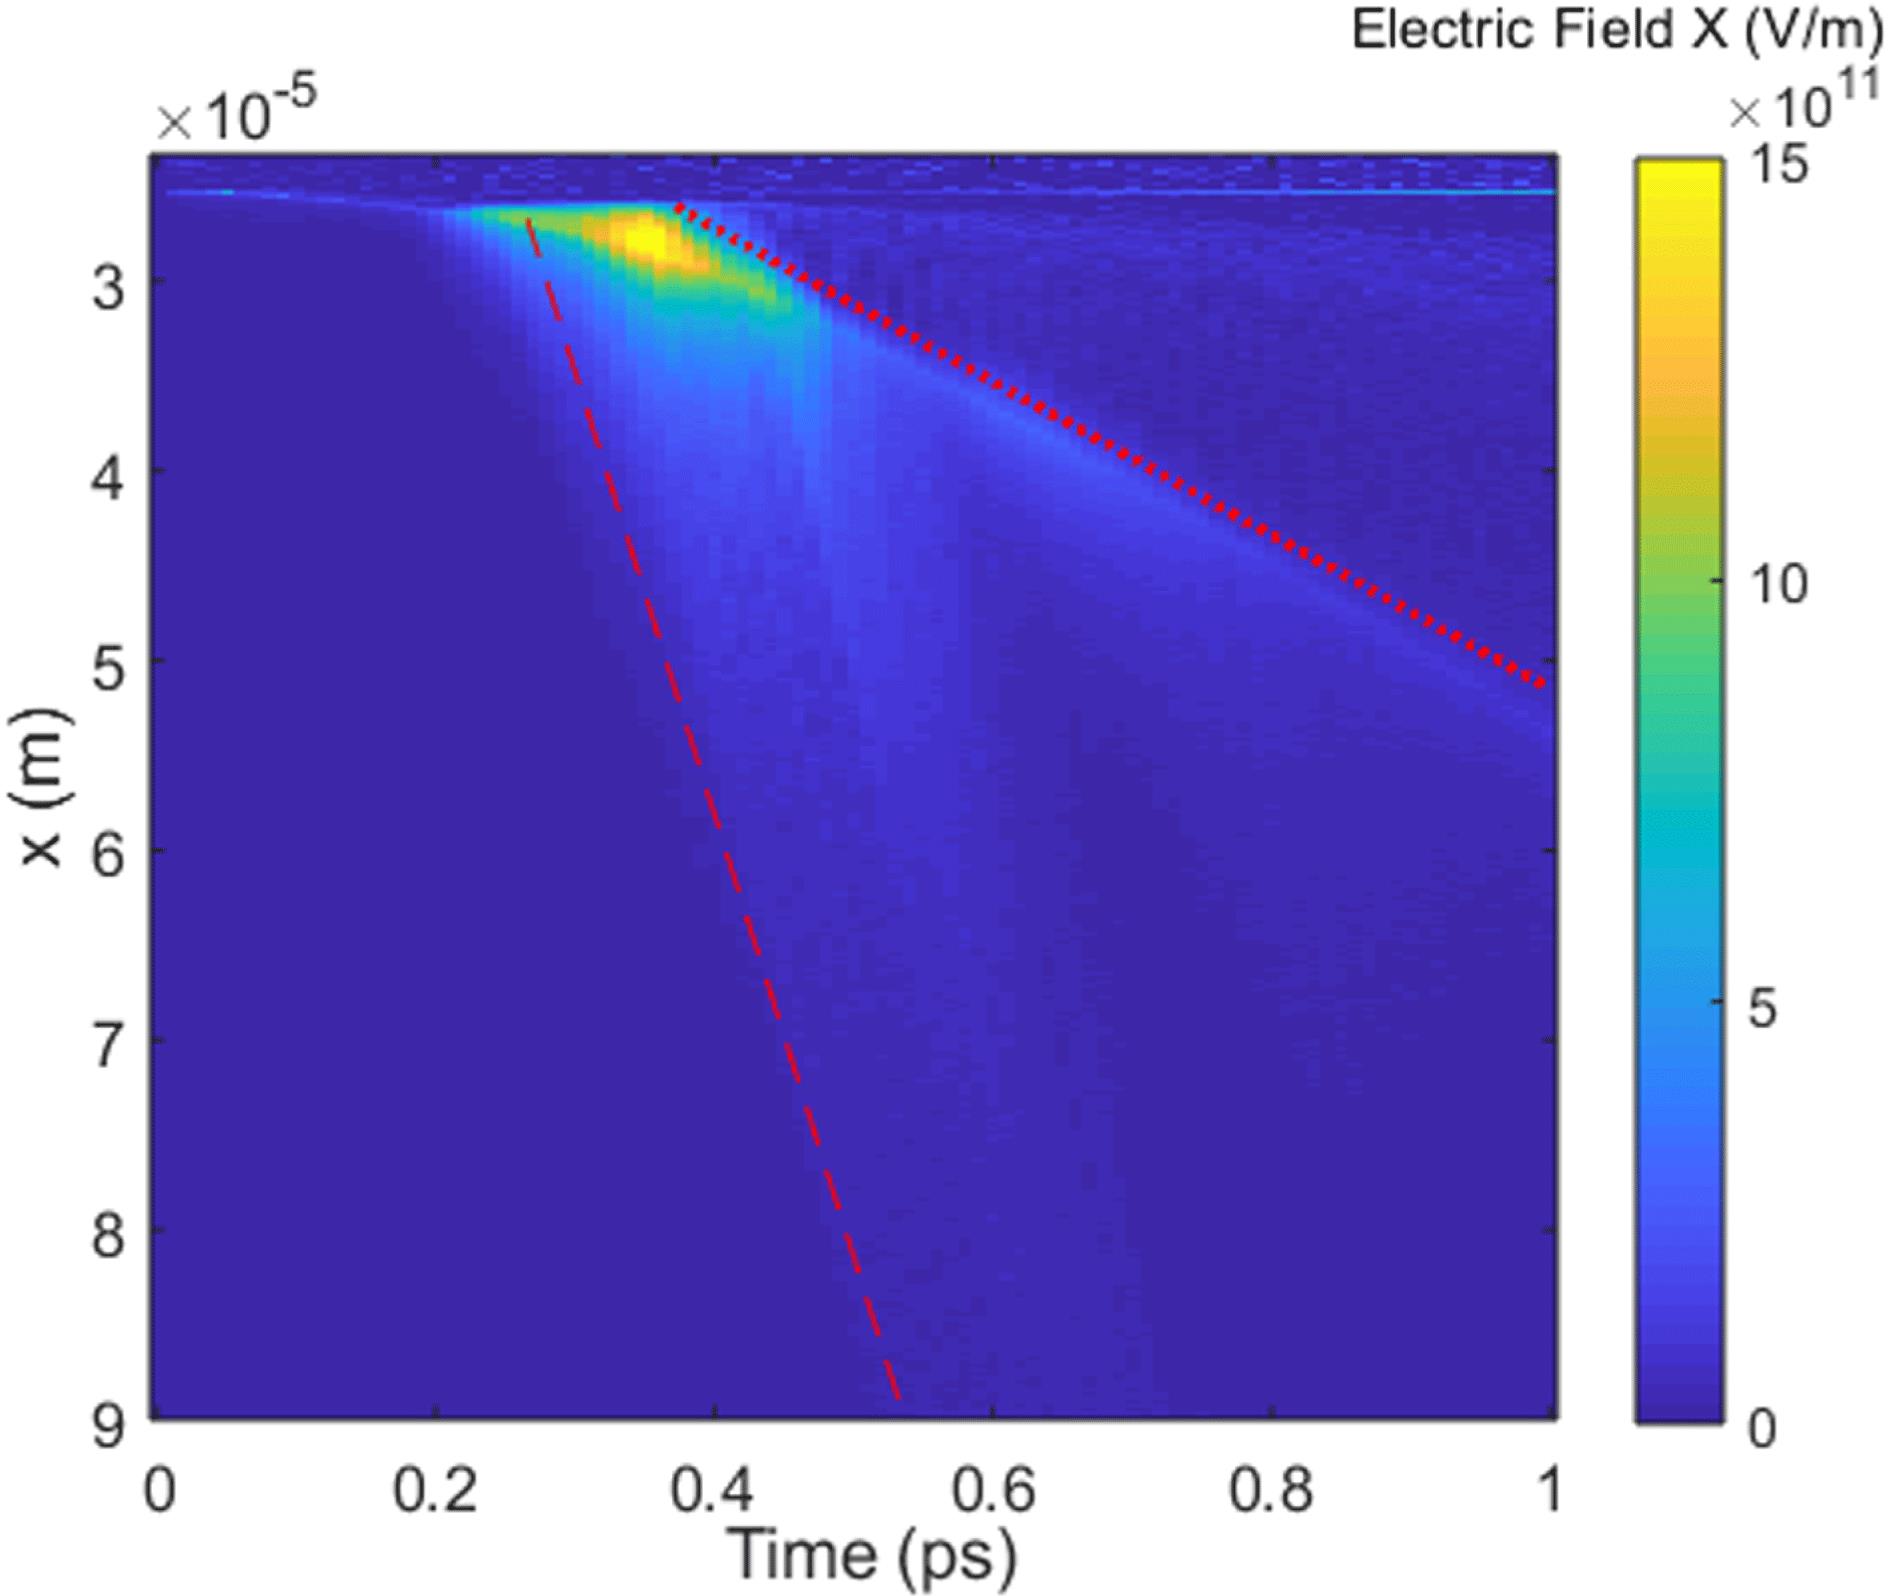
    Fig. 1. The electric field in the $x$ direction from the $1\times 10^{20}~\text{W}/\text{cm}^{2}$ simulation and the middle of the target as a function of time. We see that the fields peak at approximately 0.45 ps into the simulation. The dashed line represents the fast component of the field that is caused by the relativistic escaping electrons. The slower component, represented by the dotted line, is the field associated with the TSNA mechanism.
    The simulated peak electric field as a function of incident laser intensity. Inset, the peak electric field as a function of the number of relativistic electrons.
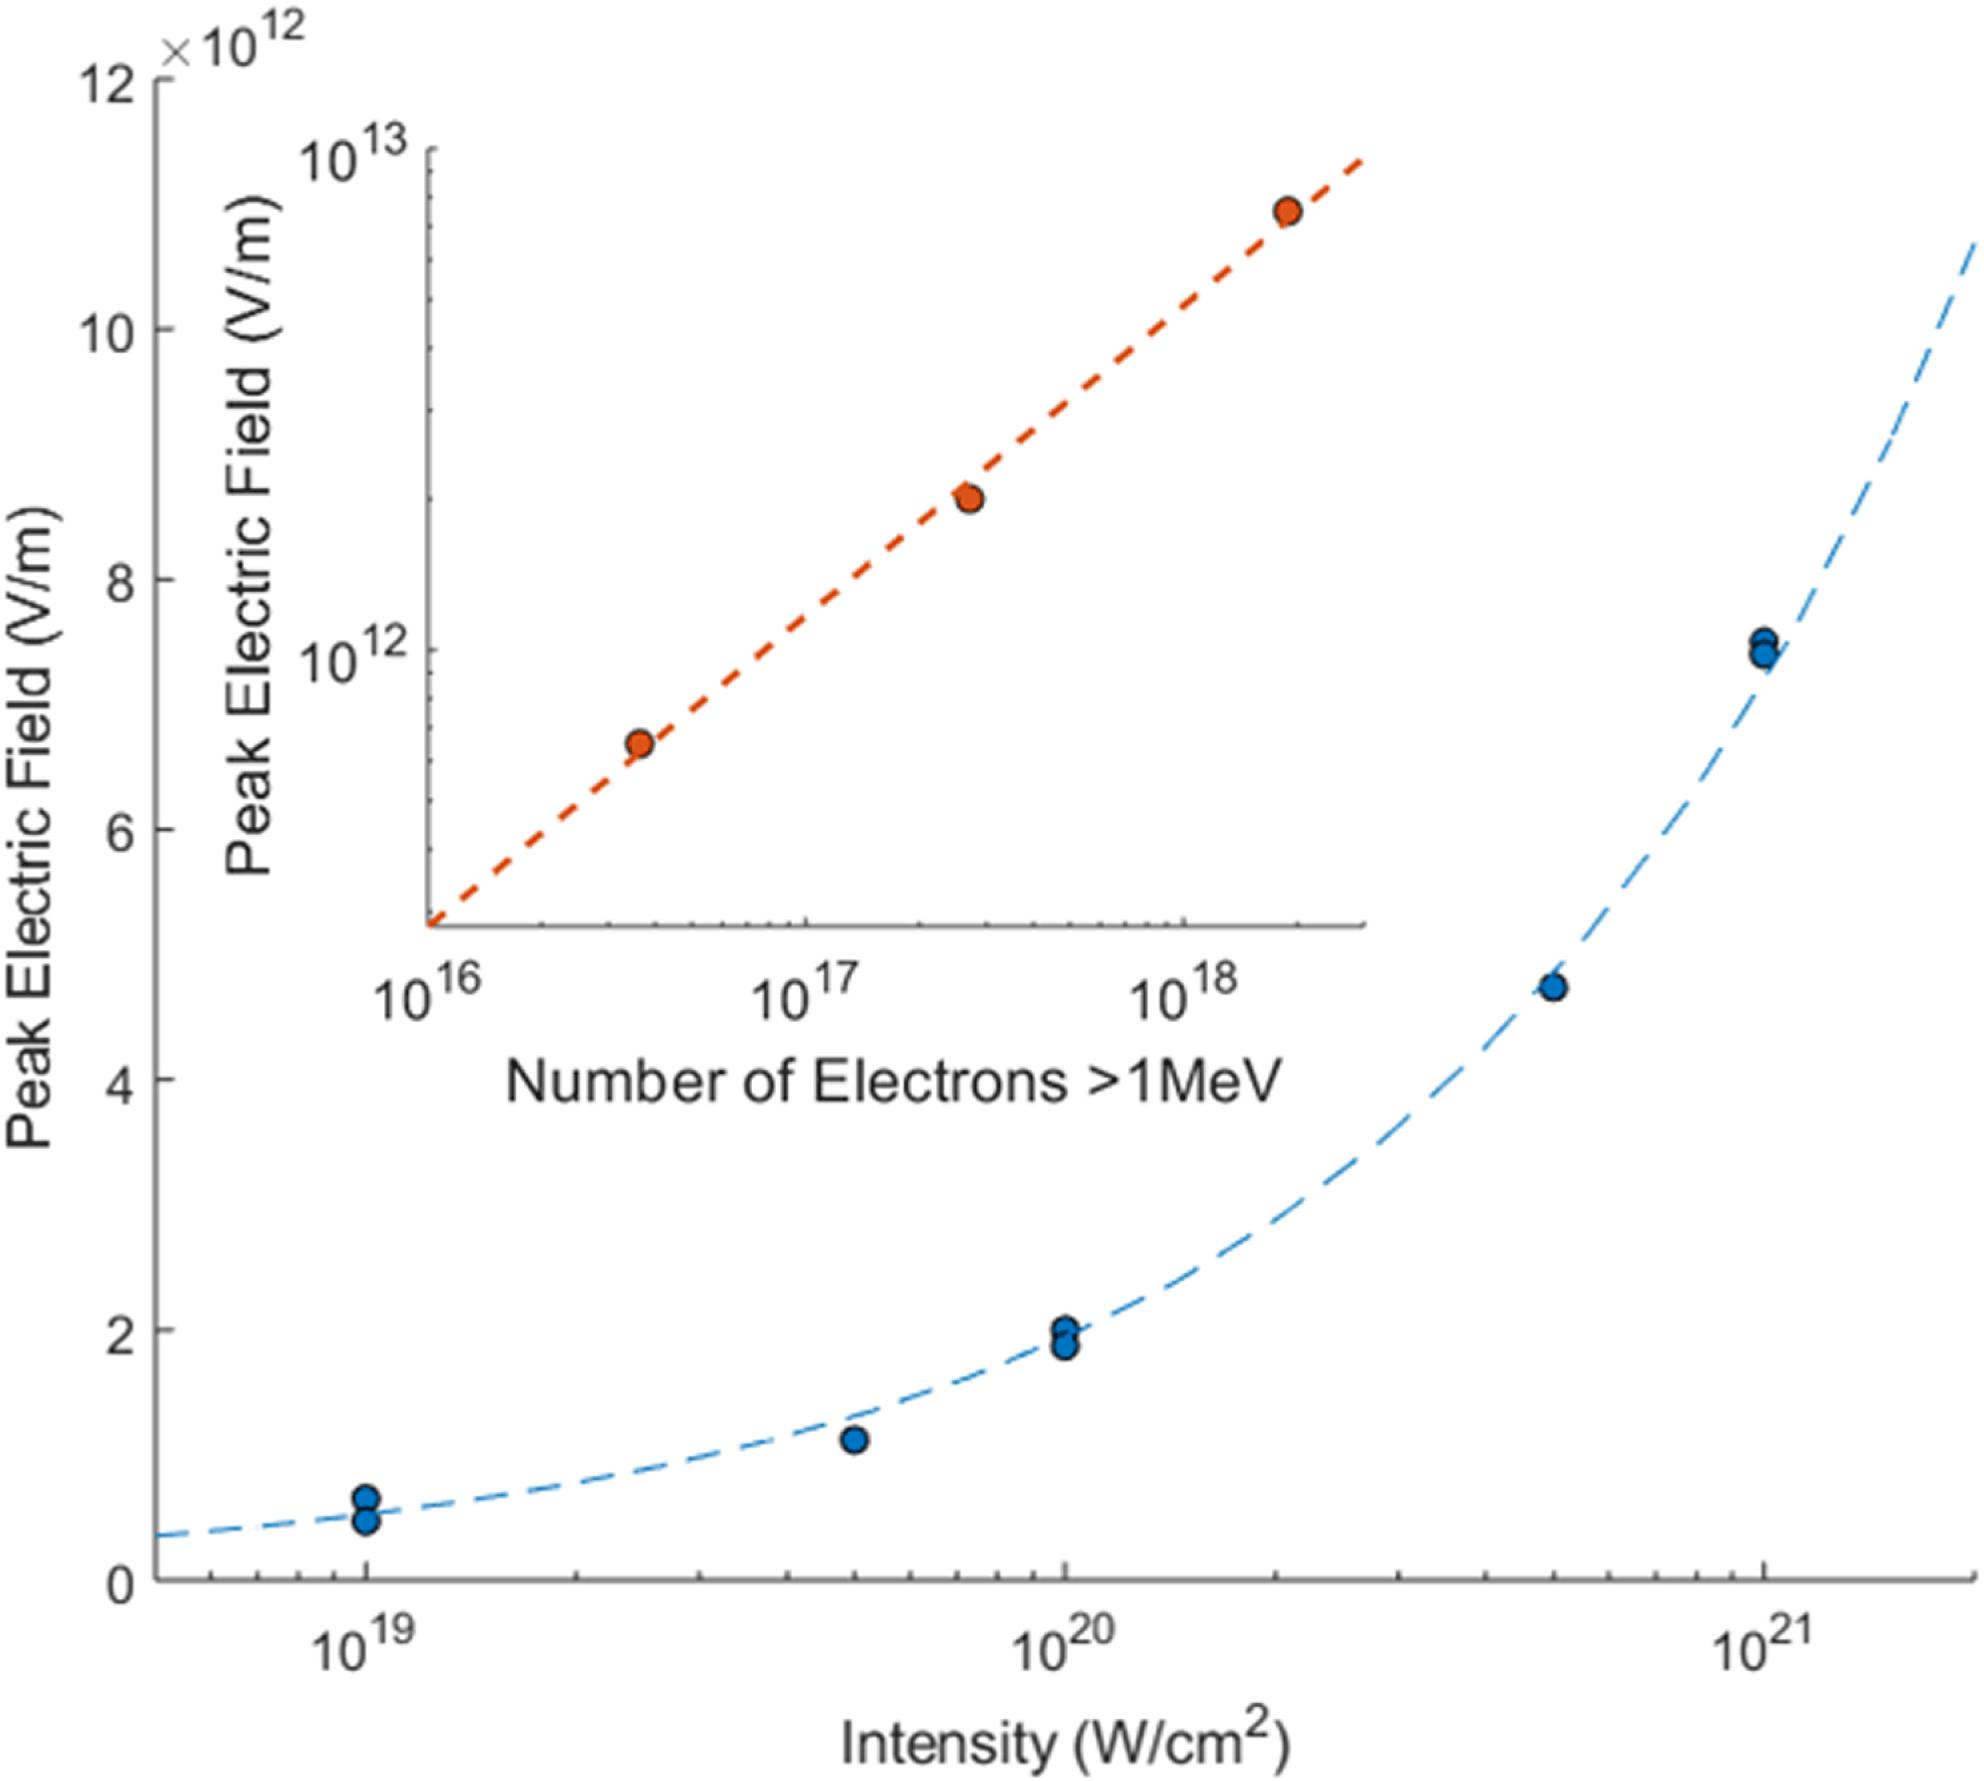
    Fig. 2. The simulated peak electric field as a function of incident laser intensity. Inset, the peak electric field as a function of the number of relativistic electrons.
    The internal hot-electron temperature (which is discussed further in Section 4) as a function of the peak electric field.
    Fig. 3. The internal hot-electron temperature (which is discussed further in Section 4) as a function of the peak electric field.
    The internal and refluxing electron spectra for three different laser intensities. A simple Boltzmann fit was applied to the data and the temperature determined.
    Fig. 4. The internal and refluxing electron spectra for three different laser intensities. A simple Boltzmann fit was applied to the data and the temperature determined.
    (a) The initial energy of the electrons prior to refluxing plotted as a function of the refluxed energy. The red dotted line represents energy equality before and after interacting with the sheath. (b) The energy difference of the refluxing electrons as a function of time. Some electrons gain energy. The largest gains and loses are observed for electrons which reach the rear of the target at the peak of the electric field.
    Fig. 5. (a) The initial energy of the electrons prior to refluxing plotted as a function of the refluxed energy. The red dotted line represents energy equality before and after interacting with the sheath. (b) The energy difference of the refluxing electrons as a function of time. Some electrons gain energy. The largest gains and loses are observed for electrons which reach the rear of the target at the peak of the electric field.
    The kinetic energy and electric field of a tracked electron as a function of distance. The arrows depict the direction of travel for the electron.
    Fig. 6. The kinetic energy and electric field of a tracked electron as a function of distance. The arrows depict the direction of travel for the electron.
    Similar to Figure 6, the kinetic energy and electric field of a tracked electron as a function of distance. The break in the lines occurs as the electron drops below the energy threshold set for the outputs.
    Fig. 7. Similar to Figure 6, the kinetic energy and electric field of a tracked electron as a function of distance. The break in the lines occurs as the electron drops below the energy threshold set for the outputs.
    Internal and escaping electron spectra for three different laser intensities. Also plotted are the escaping electron spectra while those electrons are still inside the target.
    Fig. 8. Internal and escaping electron spectra for three different laser intensities. Also plotted are the escaping electron spectra while those electrons are still inside the target.
    Electron density maps of electrons with energies greater than 1 MeV at the rear of the target at four different time steps. (a) and (b) show the ‘ballistic’ electrons that escape the target. The red dotted line represents the front of these electrons, which is travelling at the speed of light. (c) and (d) are taken at much later time in the simulation. At this time the rear surface sheath has begun to expand. This expansion is much slower, but contains much more electrons than the ballistic escaping electrons.
    Fig. 9. Electron density maps of electrons with energies greater than 1 MeV at the rear of the target at four different time steps. (a) and (b) show the ‘ballistic’ electrons that escape the target. The red dotted line represents the front of these electrons, which is travelling at the speed of light. (c) and (d) are taken at much later time in the simulation. At this time the rear surface sheath has begun to expand. This expansion is much slower, but contains much more electrons than the ballistic escaping electrons.
    Spatial maps of the electric field at the rear of the target at four time steps that coincide with those shown in Figure 9. Initially the electric field is strong, (a) and (b), restricting the electrons from escaping. Those that do, escape ballistically, as shown in Figures 9(a) and 9(b). At later times, (c) and (d), the sheath field is expanding out of the rear of the target, allowing the plasma electrons to also expand.
    Fig. 10. Spatial maps of the electric field at the rear of the target at four time steps that coincide with those shown in Figure 9. Initially the electric field is strong, (a) and (b), restricting the electrons from escaping. Those that do, escape ballistically, as shown in Figures 9(a) and 9(b). At later times, (c) and (d), the sheath field is expanding out of the rear of the target, allowing the plasma electrons to also expand.
    (a) The initial internal electron energy plotted against the ballistic escaping energy. All these electrons appear to lose energy upon leaving the target. (b) The energy difference between the escaping electrons as a function of the time at which they pass the external boundary.
    Fig. 11. (a) The initial internal electron energy plotted against the ballistic escaping energy. All these electrons appear to lose energy upon leaving the target. (b) The energy difference between the escaping electrons as a function of the time at which they pass the external boundary.
    The kinetic energy and electric field in the $x$ direction as functions of position for an escaping electron. The electron is able to overcome the field, and in doing so loses a significant portion of its energy.
    Fig. 12. The kinetic energy and electric field in the $x$ direction as functions of position for an escaping electron. The electron is able to overcome the field, and in doing so loses a significant portion of its energy.
    The change in energy of the escaping electrons as a function of the integrated electric field in the $x$ direction that each experiences between the rear surface and the external boundary at $60~\unicode[STIX]{x03BC}\text{m}$. The small population of electrons that appears below the main distribution is the earliest electrons that are part of the expanding plasma.
    Fig. 13. The change in energy of the escaping electrons as a function of the integrated electric field in the $x$ direction that each experiences between the rear surface and the external boundary at $60~\unicode[STIX]{x03BC}\text{m}$. The small population of electrons that appears below the main distribution is the earliest electrons that are part of the expanding plasma.
    D. R. Rusby, C. D. Armstrong, G. G. Scott, M. King, P. McKenna, D. Neely. Effect of rear surface fields on hot, refluxing and escaping electron populations via numerical simulations[J]. High Power Laser Science and Engineering, 2019, 7(3): 03000e45
    Download Citation