
Xingwei He, Xiuqing Hu, Lingli He, Ling Wang, Bingcheng Tao, Wenjie Hu, Xiaohu Feng. Surface Reflectance Spectral Characteristic Model of Desert Calibration Site Network in Northwest China[J]. Acta Optica Sinica, 2022, 42(6): 0628003
- Acta Optica Sinica
- Vol. 42, Issue 6, 0628003 (2022)
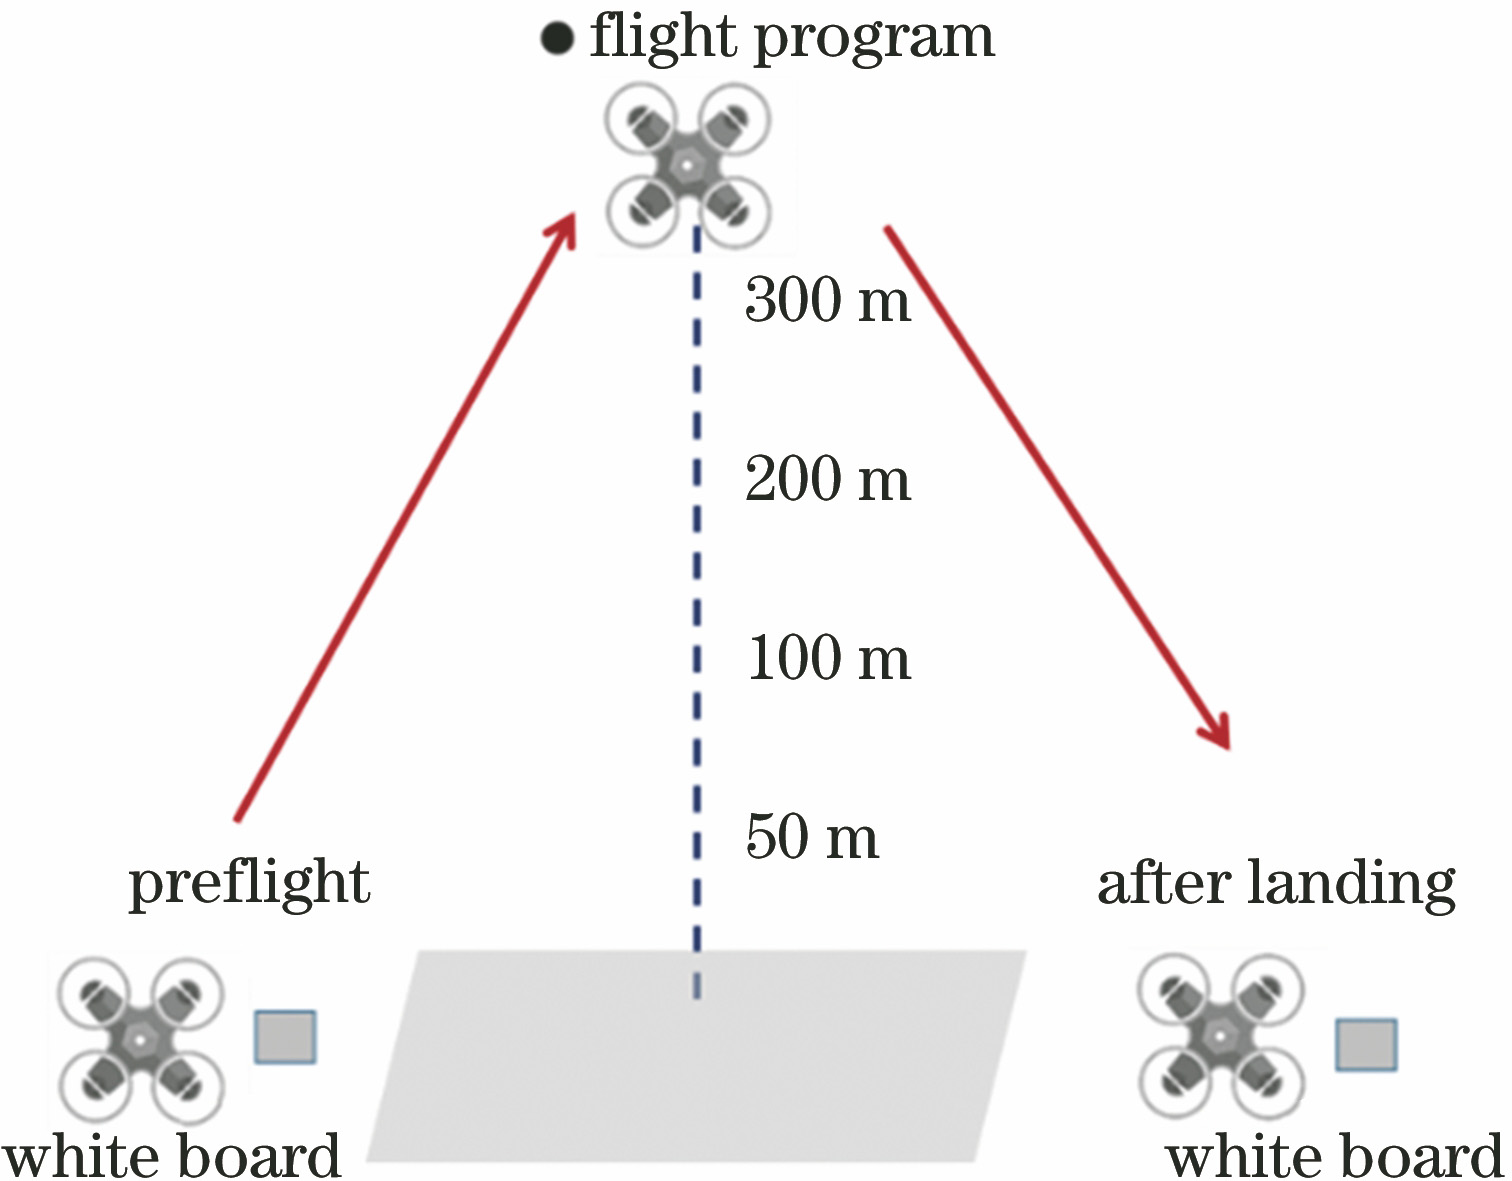
Fig. 1. Schematic diagram of UAV observation scheme
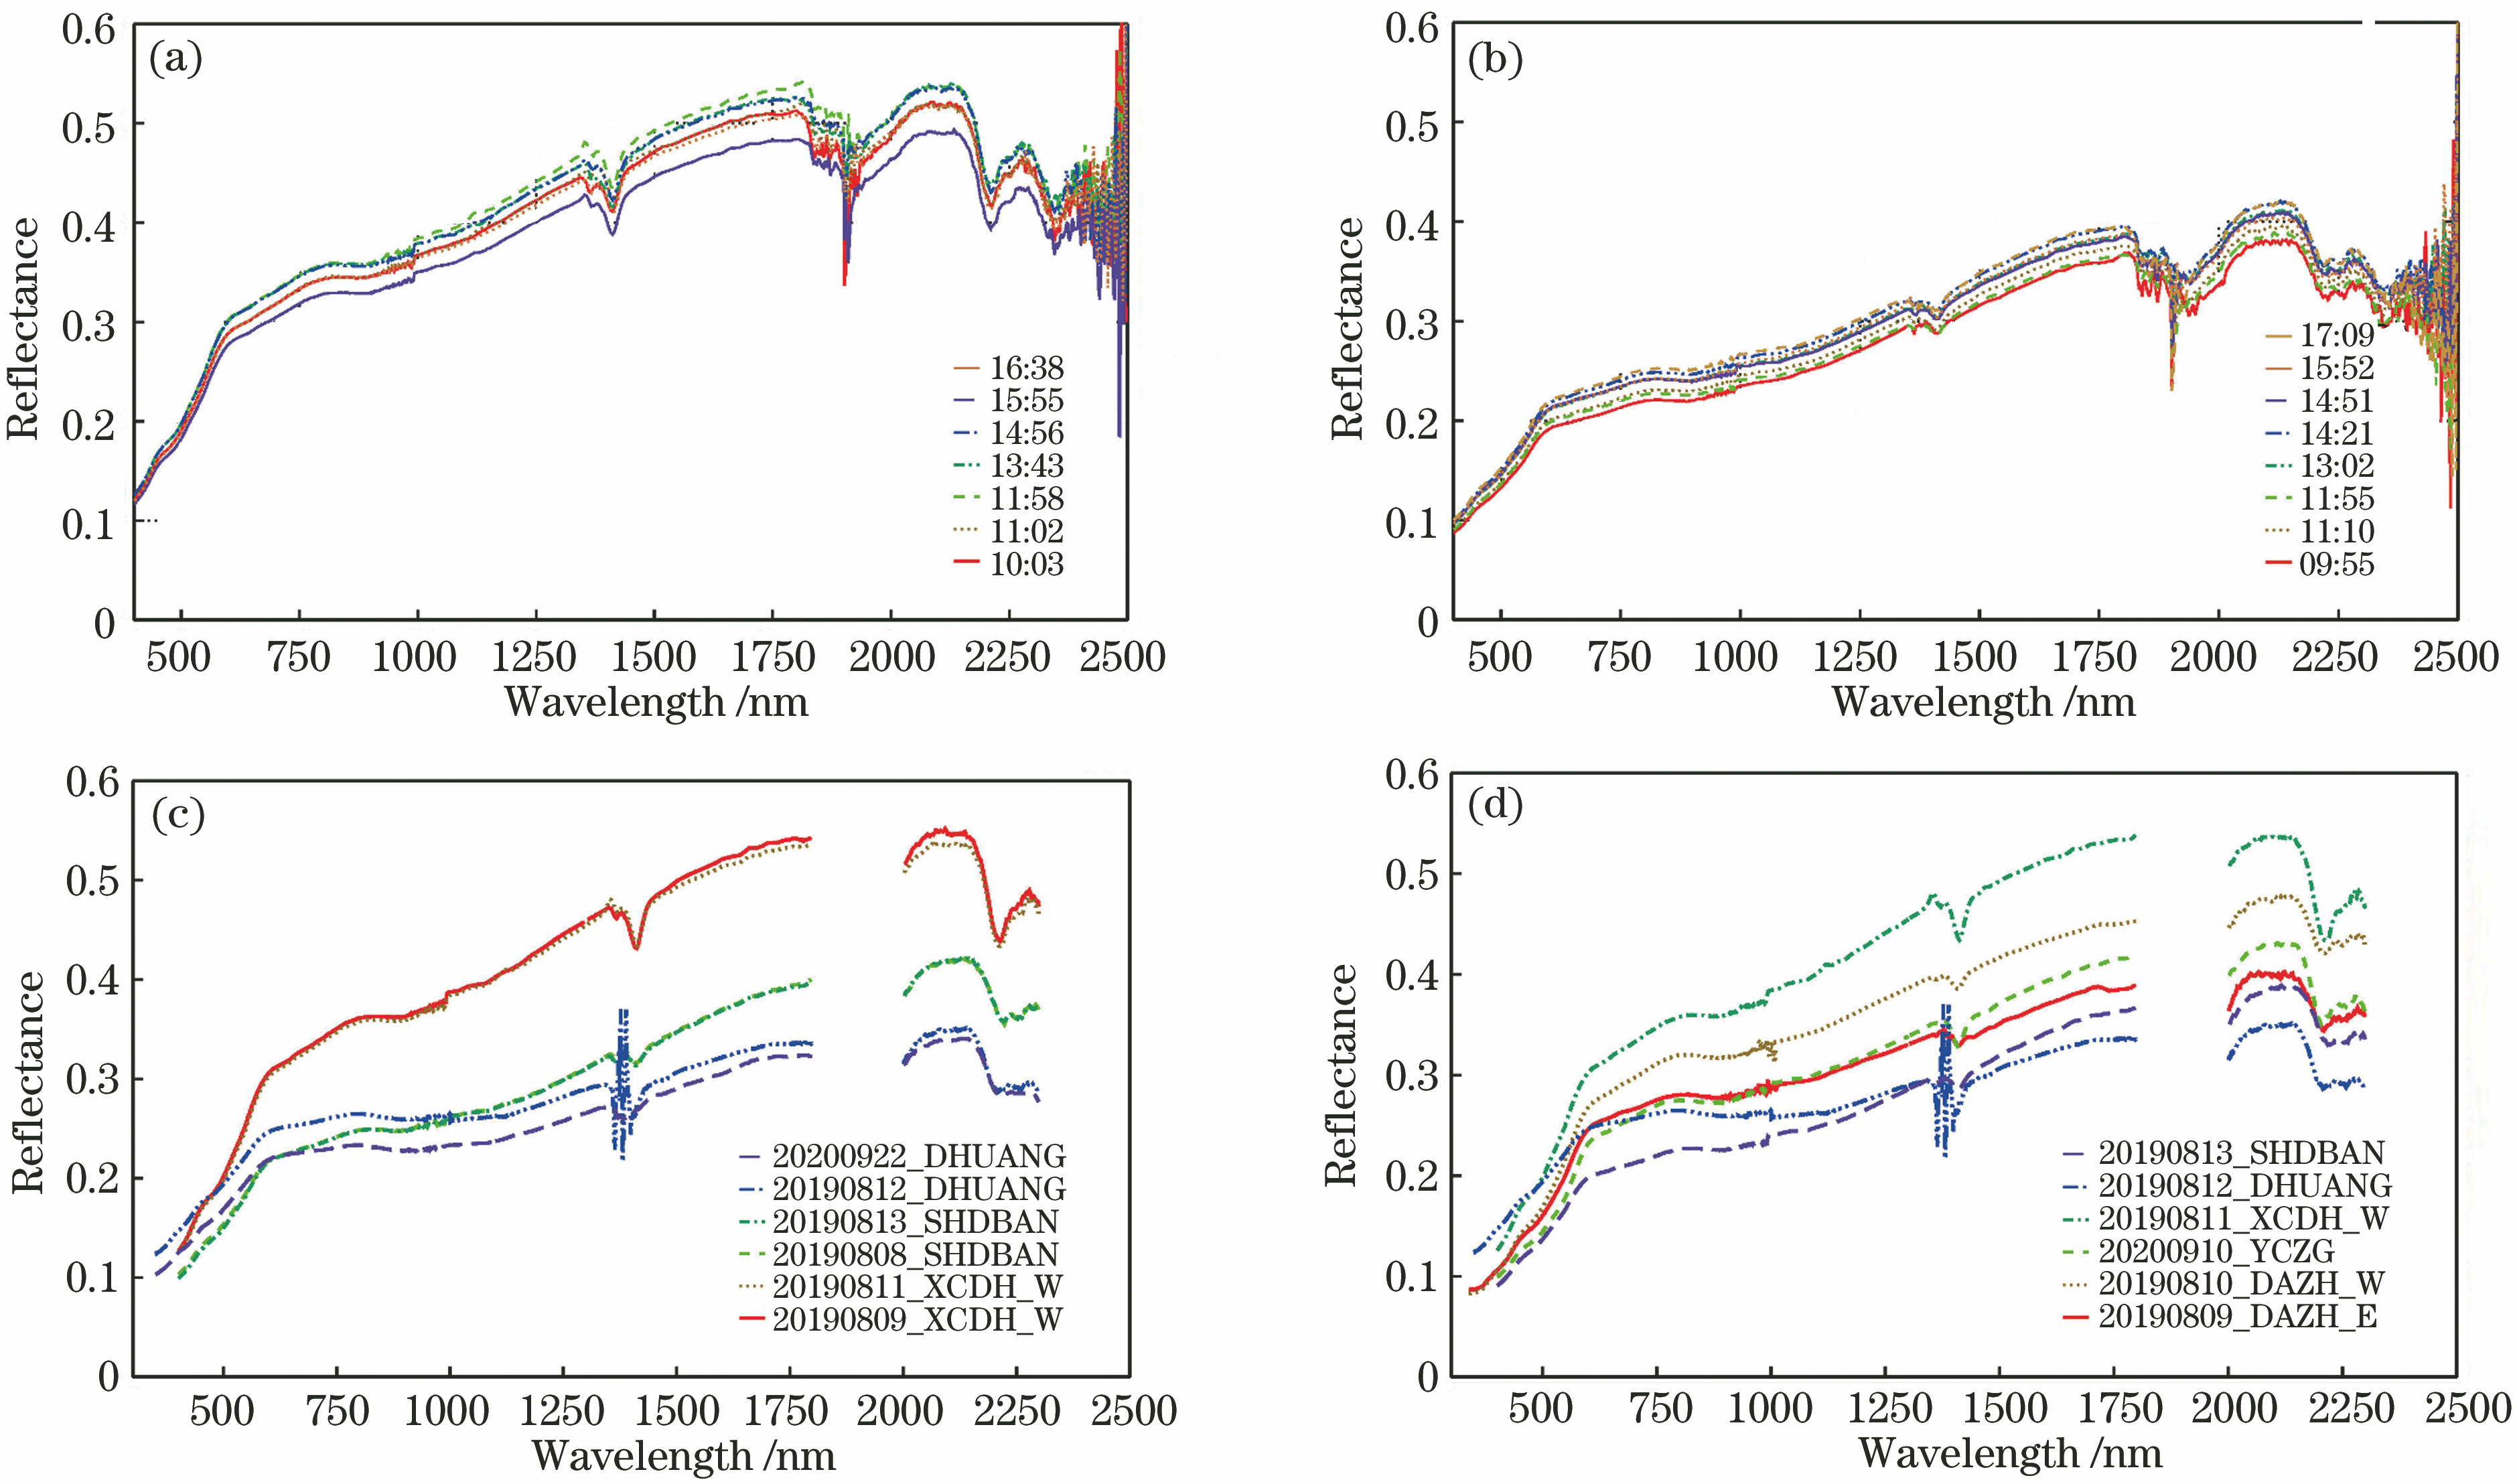
Fig. 2. Surface reflectance spectra of different sites at different times. (a) Surface reflectance spectra of XCDH_W at different times on August 11, 2019; (b) surface reflectance spectra of SHDBAN at different times on August 13, 2019; (c) spectral comparison among XCDH_W, SHDBAN and DHANG at same time or adjacent time; (d) Comparison of reflectance spectra among XCDH_W, SHDBAN, DHANG, YCZG, DAZH_E and DAZH_W
Fig. 3. Surface reflectance spectra at different scales. (a) Comparison between surface reflectance spectra measured by SVC and spectra of MCD43 reflectance product at XCDH_W and SHDBAN; (b) comparison between surface reflectance spectra measured by UAV and SVC at XCDH_W and SHDBANC
Fig. 4. Schematic diagram of spectral angle
Fig. 5. Sensitivity analysis of surface reflectance with four parameters. (a) Surface reflectance varying with A; (b) surface reflectance varying with β; (c) surface reflectance varying with α; (d) surface reflectance varying with B
Fig. 6. Comparison between measured and simulated reflectance spectra of calibration sites. (a) ALSH, WHAI_W, BDJL; (b) YCZG, XCDH_W, DAZH_W, DAZH_E;(c) MQIN, DHUANG, SHDBAN
Fig. 7. Relative deviation of reflectance of top of atmosphere for different MERSI channels based on two different surface reflectance spectra
|
Table 1. Latitude and longitude information of 10 calibration sites
|
Table 2. Relative deviation of reflectance between SVC and MODIS observationsunit: %
|
Table 3. Spectral angle, RMSE and R of reflectance spectra observed by SVC and UAV
|
Table 4. Spectral model parameters and statistical factors for different sites
|
Table 5. Observational geometry and atmospheric parameters of SHDBAN and XCDH_W

Set citation alerts for the article
Please enter your email address
© Copyright 2018-2021 | Chinese Laser Press. All Rights Reserved 沪ICP备15018463号-20