
P. Kubes, M. Paduch, M. J. Sadowski, J. Cikhardt, D. Klir, J. Kravarik, R. Kwiatkowski, V. Munzar, K. Rezac, A. Szymaszek, K. Tomaszewski, E. Zielinska, M. Akel, B. Cikhardtova. Scenario of a magnetic dynamo and magnetic reconnection in a plasma focus discharge[J]. Matter and Radiation at Extremes, 2020, 5(4): 046401
- Matter and Radiation at Extremes
- Vol. 5, Issue 4, 046401 (2020)
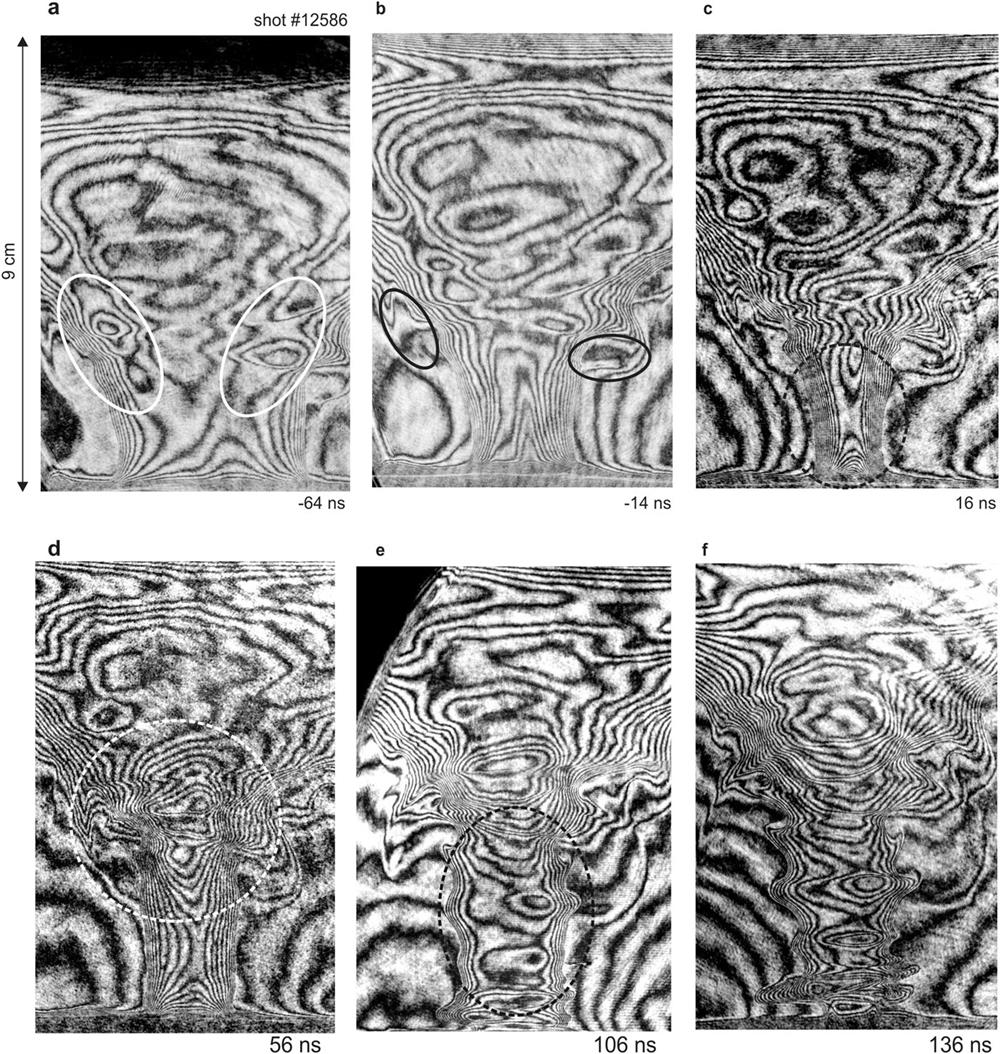
Fig. 1. Interferometric frames from shot 12 586. (a) and (b) During the implosion. (c) and (d) During the formation of the plasmoid. (e) and (f) During the stagnation phase. In (a), the internal toroidal structures are within the solid white ellipses. In (b), the external toroidal structures are within the solid black ellipses. In (c), the maximal axial current flow in the column occurs within the dashed black ellipse. In (d), the internal plasmoidal structure is within the white dashed ellipse. In (e), the phase of the pinch column with rare fringes in its interior is within the black dashed ellipse.
![Interferometric frames from shot 12 605 recorded at different phases: [(a) and (b)] During the pinch stagnation. [(c), (d), and (e)] During the evolution of the constrictions. [(e) and (f)] During the decay of the plasma column structures. In (b), the black ellipse marks the profile of the toroidal tube and the dashed black line is the cross section that was used to calculate the closed currents.](/richHtml/MRE/2020/5/4/046401/img_2.jpg)
Fig. 2. Interferometric frames from shot 12 605 recorded at different phases: [(a) and (b)] During the pinch stagnation. [(c), (d), and (e)] During the evolution of the constrictions. [(e) and (f)] During the decay of the plasma column structures. In (b), the black ellipse marks the profile of the toroidal tube and the dashed black line is the cross section that was used to calculate the closed currents.
Fig. 3. XUV frames from shot 12 605 for the same discharge shown in the interferometric images in Fig. 2 . These were recorded at different phases: [(a) and (b)] During the pinch stagnation. [(c) and (d)] During the evolution of the pinch constrictions. These frames, unlike the interferometric images, show distinct helical structures at the surface of the dense plasma column and at the lobule top, which can be explained by an increase in the toroidal component after the pinch stagnation.
Fig. 4. Computation results: (a) Radial distribution of the interferometric fringes along the line of the cross section marked in Fig. 2(b) . (b) Radial distribution of the electron density calculated from the Abel transformation of the data shown in (a). (c) Distribution of the plasma pressure (dashed black line) and the magnetic pressure associated with the pinching poloidal current I p (full gray line) and the repulsive toroidal current I t (dashed gray line).
Fig. 5. Waveforms from shot 12 605. Gray: The current derivative with a dip. Green: Voltage with a peak at the smallest pinch diameter. Yellow: SXR pulses emitted at the current derivative dip, at the voltage peaks, and at the formation of the first plasmoid. Red: HXR signal. Blue: Neutrons at 2.45 MeV shifted in time. The neutrons begin to be emitted during the disruption of the constriction [Fig. 2(e) ]. The SXRs increase during the transformation of the kinetic energy into heat.
Fig. 6. Neutron signals recorded at a distance of 7 m in the downstream (blue), side-on (green), and upstream (red) directions. The temporal shift of the peaks (t ) made it possible to calculate the dominant neutron velocity (downstream and upstream) and the mean energy E d of the deuterons producing the fusion neutrons. In this shot, it was estimated that E d ≈ 100 keV at t ≈ 50 ns. In all these PF-1000 shots, E d reached values of 70 keV–500 keV. At the mean deuteron energy of 200 keV, the increase in the FWHM of the neutron pulse (measured at 7 m) was about 20 ns.

Set citation alerts for the article
Please enter your email address
© Copyright 2018-2021 | Chinese Laser Press. All Rights Reserved 沪ICP备15018463号-20