
Karla Roszeitis, Markas Sudzius, Alexander Palatnik, Rebekka Koch, Jan Carl Budich, Karl Leo. Coherence onset in PT-symmetric organic microcavities: towards directional propagation of light[J]. Journal of the European Optical Society-Rapid Publications, 2022, 18(1): 2022006
Journals >Journal of the European Optical Society-Rapid Publications >Volume 18 >Issue 1 >Page 2022006 > Article
- Journal of the European Optical Society-Rapid Publications
- Vol. 18, Issue 1, 2022006 (2022)
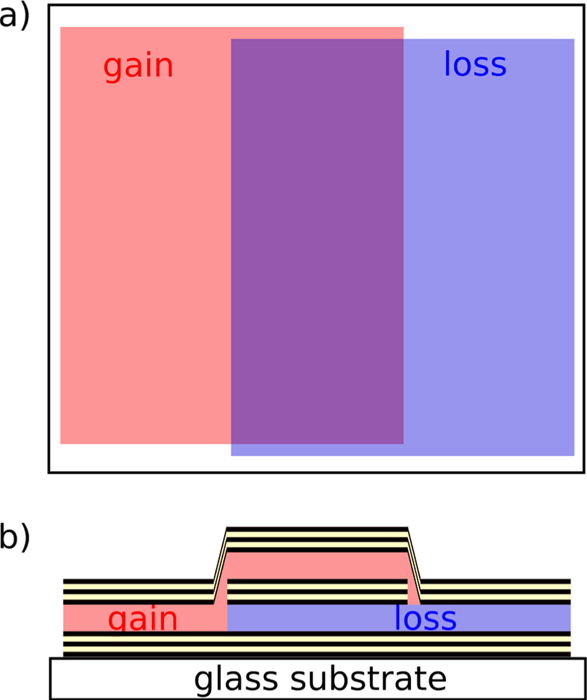
Fig. 1. Sample schematics with (a) top and (b) side view. Gain and loss cavities are sandwiched between TiO2/SiO2 distributed Bragg reflectors with 21 layers. They do overlap in the central part of the sample, separated by a third distributed Bragg reflector with 9 layers, leading to a coupled system. All reflector layers are of λ/4 optical thickness, cavity layers of λ/2 optical thickness, at design wavelength λD = 620 nm.
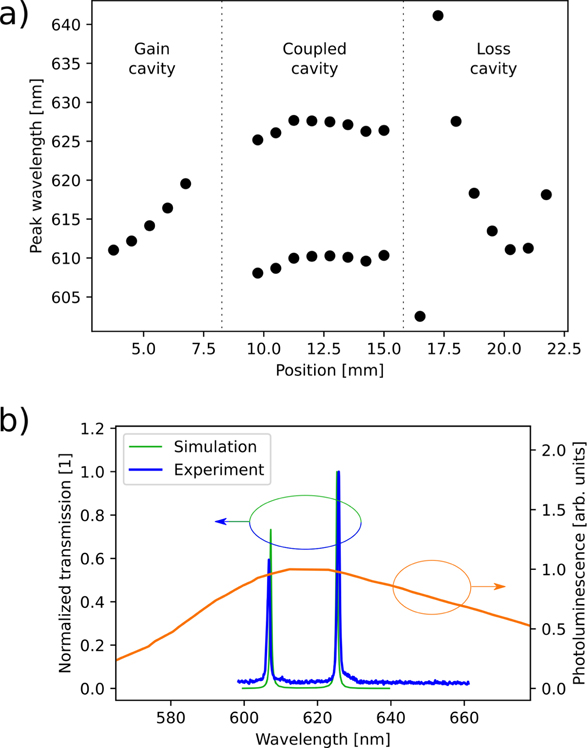
Fig. 2. (a) Spectral position of the modes across the sample in all three distinct sample regions. (b) Characteristic white light transmission spectrum through the coupled cavity region in experiment (blue) and transfer-matrix simulation (green), and PL spectrum of an Alq3:DCM neat layer.
Fig. 3. Input–output characteristics in forward direction (blue curves, see inset) show an up to one order higher output intensity compared to backward direction measurements (orange curves) in some pump power regimes. The curves stem from different spots on a coupled cavity device. All curves are shifted along x- and y-direction to coincide before lasing starts (green cross), see main text for further information. Pump power ranges for every curve from 10−1 μW to 102 μW energy input into the sample.
Fig. 4. Time evolution of the electric field distribution after the population inversion gets introduced into the gain cavity and starts to recombine radiatively. The calculation was done for four different extinction coefficient values for the absorbing cavity, while the amount of gain was kept fixed.
Fig. 5. Time- and spectrally-integrated emission signal as a function of the extinction coefficient of a loss cavity.
Fig. 6. (a) Reflectivity spectra obtained from T-matrix simulations for a planar wave, impinging on a stack of 10 coupled cavities (separated by 15 and 11 layer DBRs in alternation) normal to the 1D topological chain, shown for two propagation directions. Gain/loss parameter is γ = 1.87. (b) Spectral distribution of eigenvalues of this chain, obtained from the tight-binding model.

Set citation alerts for the article
Please enter your email address
© Copyright 2018-2021 | Chinese Laser Press. All Rights Reserved 沪ICP备15018463号-20