• Chinese Optics Letters
  • Vol. 14, Issue 7, 071702 (2016)
Lin Zhang1, Chuangjian Cai1, Yanlu Lv1, and Jianwen Luo1、2、*
Author Affiliations
  • 1Department of Biomedical Engineering, Tsinghua University, Beijing 100084, China
  • 2Center for Biomedical Imaging Research, Tsinghua University, Beijing 100084, China
  • show less
    DOI: 10.3788/COL201614.071702 Cite this Article Set citation alerts
    Lin Zhang, Chuangjian Cai, Yanlu Lv, Jianwen Luo. Early-photon guided reconstruction method for time-domain fluorescence lifetime tomography[J]. Chinese Optics Letters, 2016, 14(7): 071702 Copy Citation Text show less
    Schematic of the measurement system.
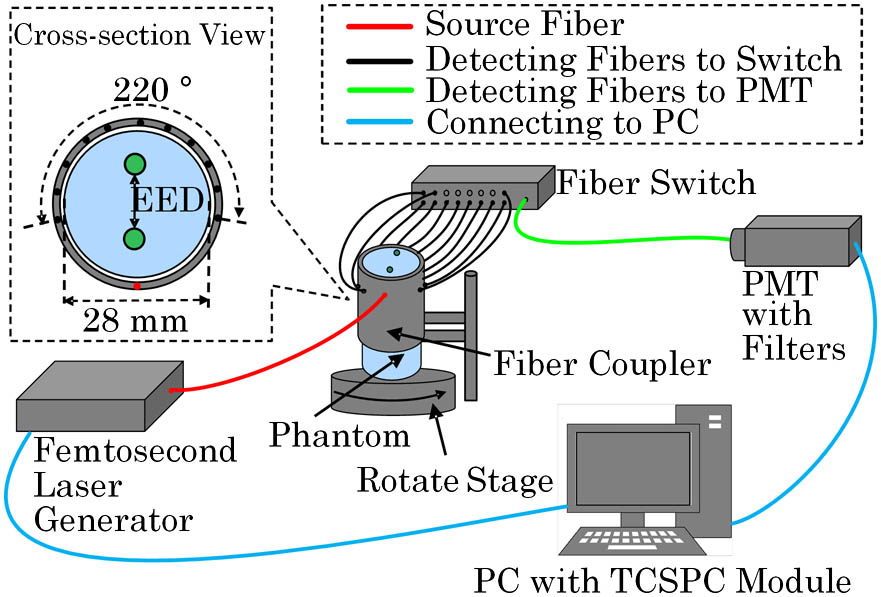
    Fig. 1. Schematic of the measurement system.
    Reconstruction results of (a) and (b) Expt. 1 and (c) and (d) Expt. 2. (a) and (c) denote the inverse lifetime maps obtained by the EPFLT method, while (b) and (d) denote those obtained by the DFLT method. The red and green circles denote the phantom border and the position of fluorescence targets, respectively.
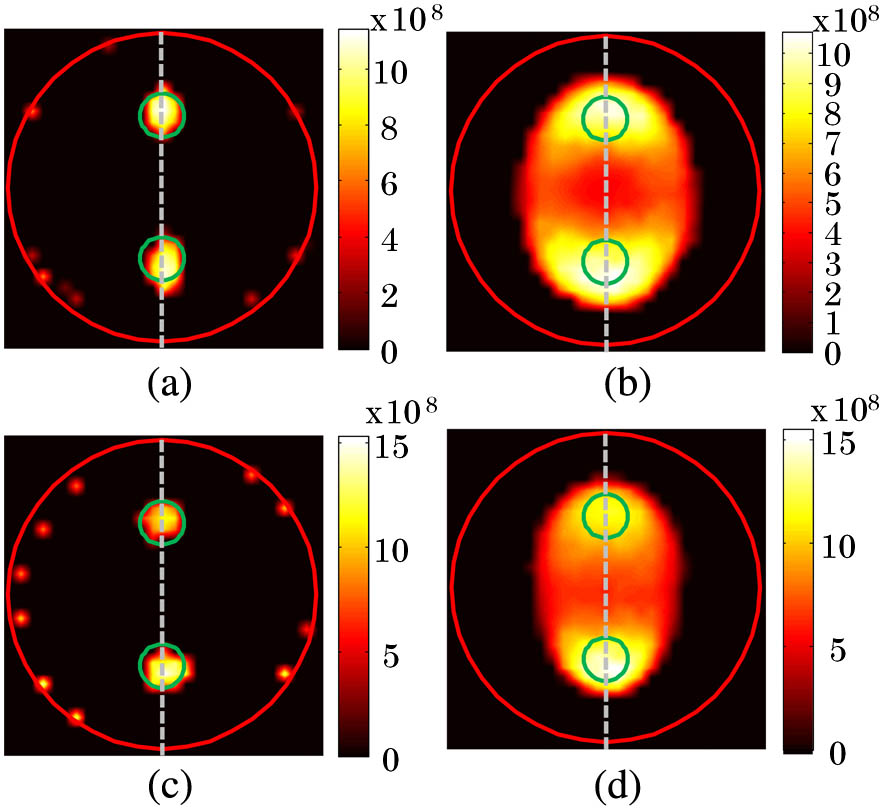
    Fig. 2. Reconstruction results of (a) and (b) Expt. 1 and (c) and (d) Expt. 2. (a) and (c) denote the inverse lifetime maps obtained by the EPFLT method, while (b) and (d) denote those obtained by the DFLT method. The red and green circles denote the phantom border and the position of fluorescence targets, respectively.
    Reconstruction results of (a) and (b) Expt. 3 and (c) and (d) Expt. 4. (a) and (c) denote the inverse lifetime maps obtained by the EPFLT method, while (b) and (d) denote those obtained by the DFLT method. The red and green circles denote the phantom border and the position of fluorescence targets, respectively.
    Fig. 3. Reconstruction results of (a) and (b) Expt. 3 and (c) and (d) Expt. 4. (a) and (c) denote the inverse lifetime maps obtained by the EPFLT method, while (b) and (d) denote those obtained by the DFLT method. The red and green circles denote the phantom border and the position of fluorescence targets, respectively.
    Profiles along the dashed-dotted lines in Figs. 2 and 3 for (a) Expt. 1, (b) Expt. 2, (c) Expt. 3, and (d) Expt. 4. The red lines denote the real inverse lifetime profiles, while the blue and green lines denote the inverse lifetime results obtained by the EPFLT and DFLT methods, respectively.
    Fig. 4. Profiles along the dashed-dotted lines in Figs. 2 and 3 for (a) Expt. 1, (b) Expt. 2, (c) Expt. 3, and (d) Expt. 4. The red lines denote the real inverse lifetime profiles, while the blue and green lines denote the inverse lifetime results obtained by the EPFLT and DFLT methods, respectively.
    Expt.SolventτEP(ns)τD(ns)Real lifetime (ns)REEP (%)RED (%)
    1DMSO0.8741.0680.979.910.1
    DMSO0.9421.0370.972.96.9
    2DMSO0.8270.8430.9714.713.1
    ALC0.6520.6400.625.23.2
    3DMSO1.0221.0190.975.45.0
    DMSO0.9980.9930.972.92.4
    4DMSO0.9021.0670.977.010.0
    ALC0.6720.8530.628.437.5
    Table 1. Comparison of Fluorescence Lifetimes and Relative Errors by the EPFLT and DLFT Methods
    Expt.MethodCNRRD (%)Real RD (%)RC (%)
    1EPFLT7.377.800
    DFLT2.383.0046.6
    2EPFLT6.0026.856.450
    DFLT2.3031.756.4553.8
    3EPFLT4.452.400
    DFLT2.652.0063.5
    4EPFLT4.3934.256.450
    DFLT2.448.556.4577.7
    Table 2. Comparisons of Contrasts and Crosstalks
    Lin Zhang, Chuangjian Cai, Yanlu Lv, Jianwen Luo. Early-photon guided reconstruction method for time-domain fluorescence lifetime tomography[J]. Chinese Optics Letters, 2016, 14(7): 071702
    Download Citation