Author Affiliations
1College of Information and Computer, Taiyuan University of Technology, Jinzhong, Shanxi 0 30600, China2Computer Science Department, University of North Texas, Denton, Texas 76201, United Statesshow less
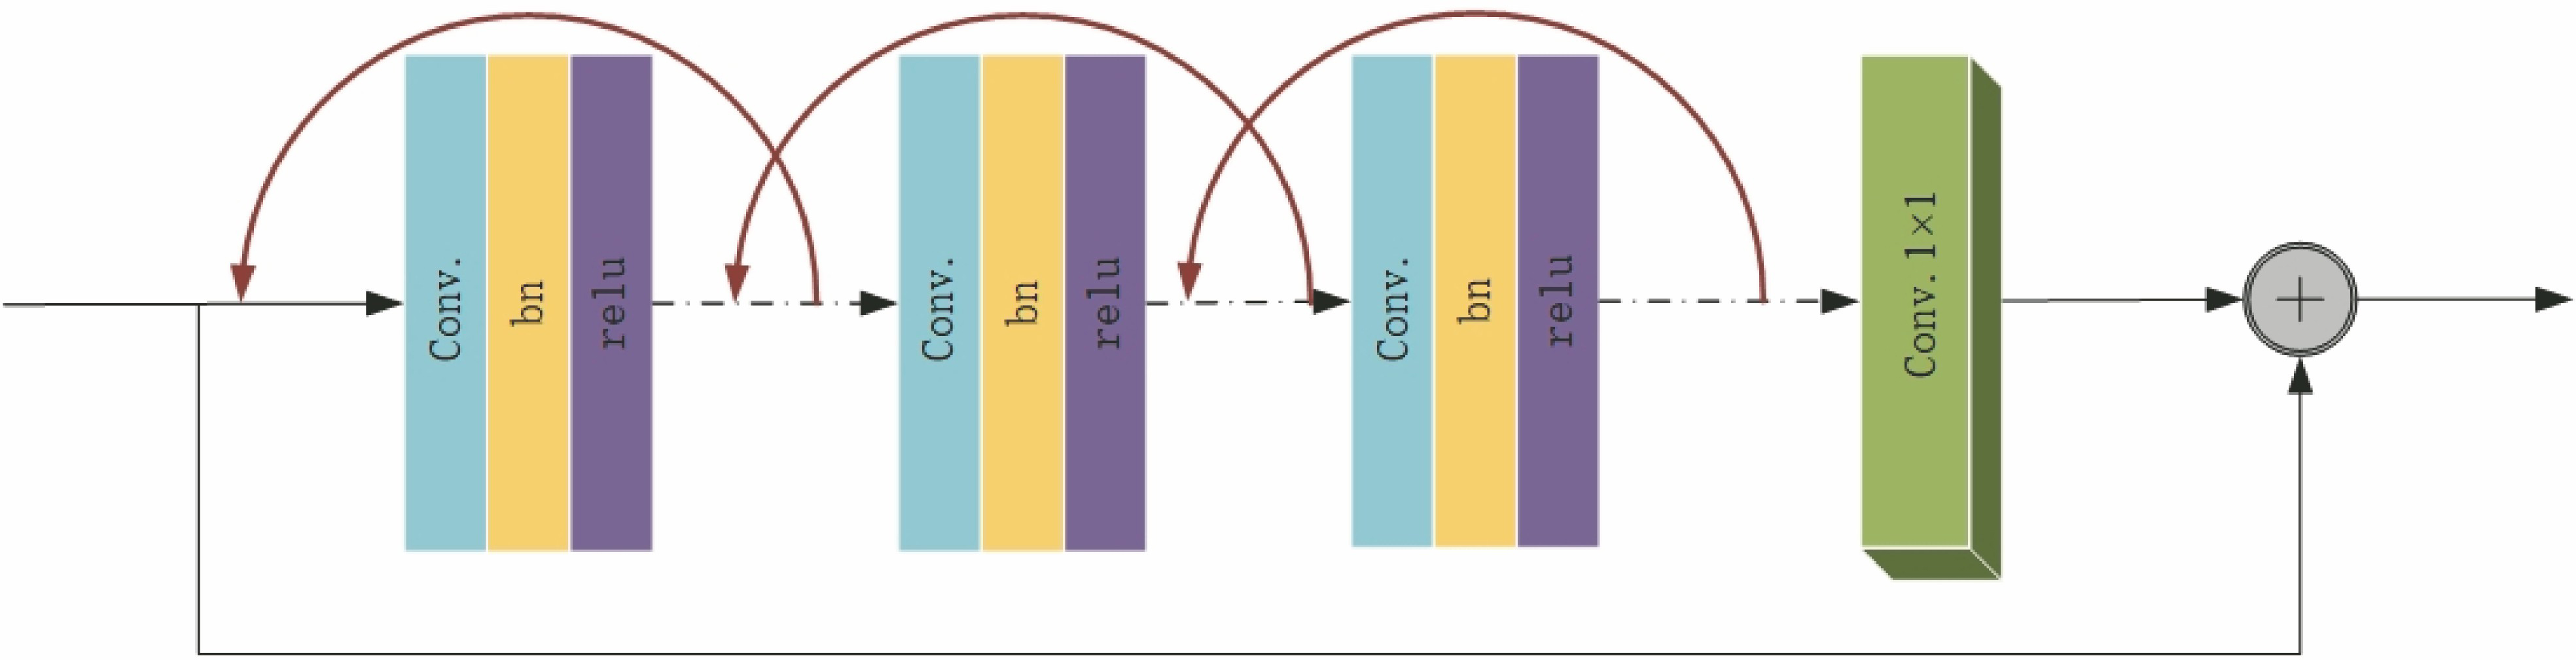
Fig. 1. Schematic of R2CU
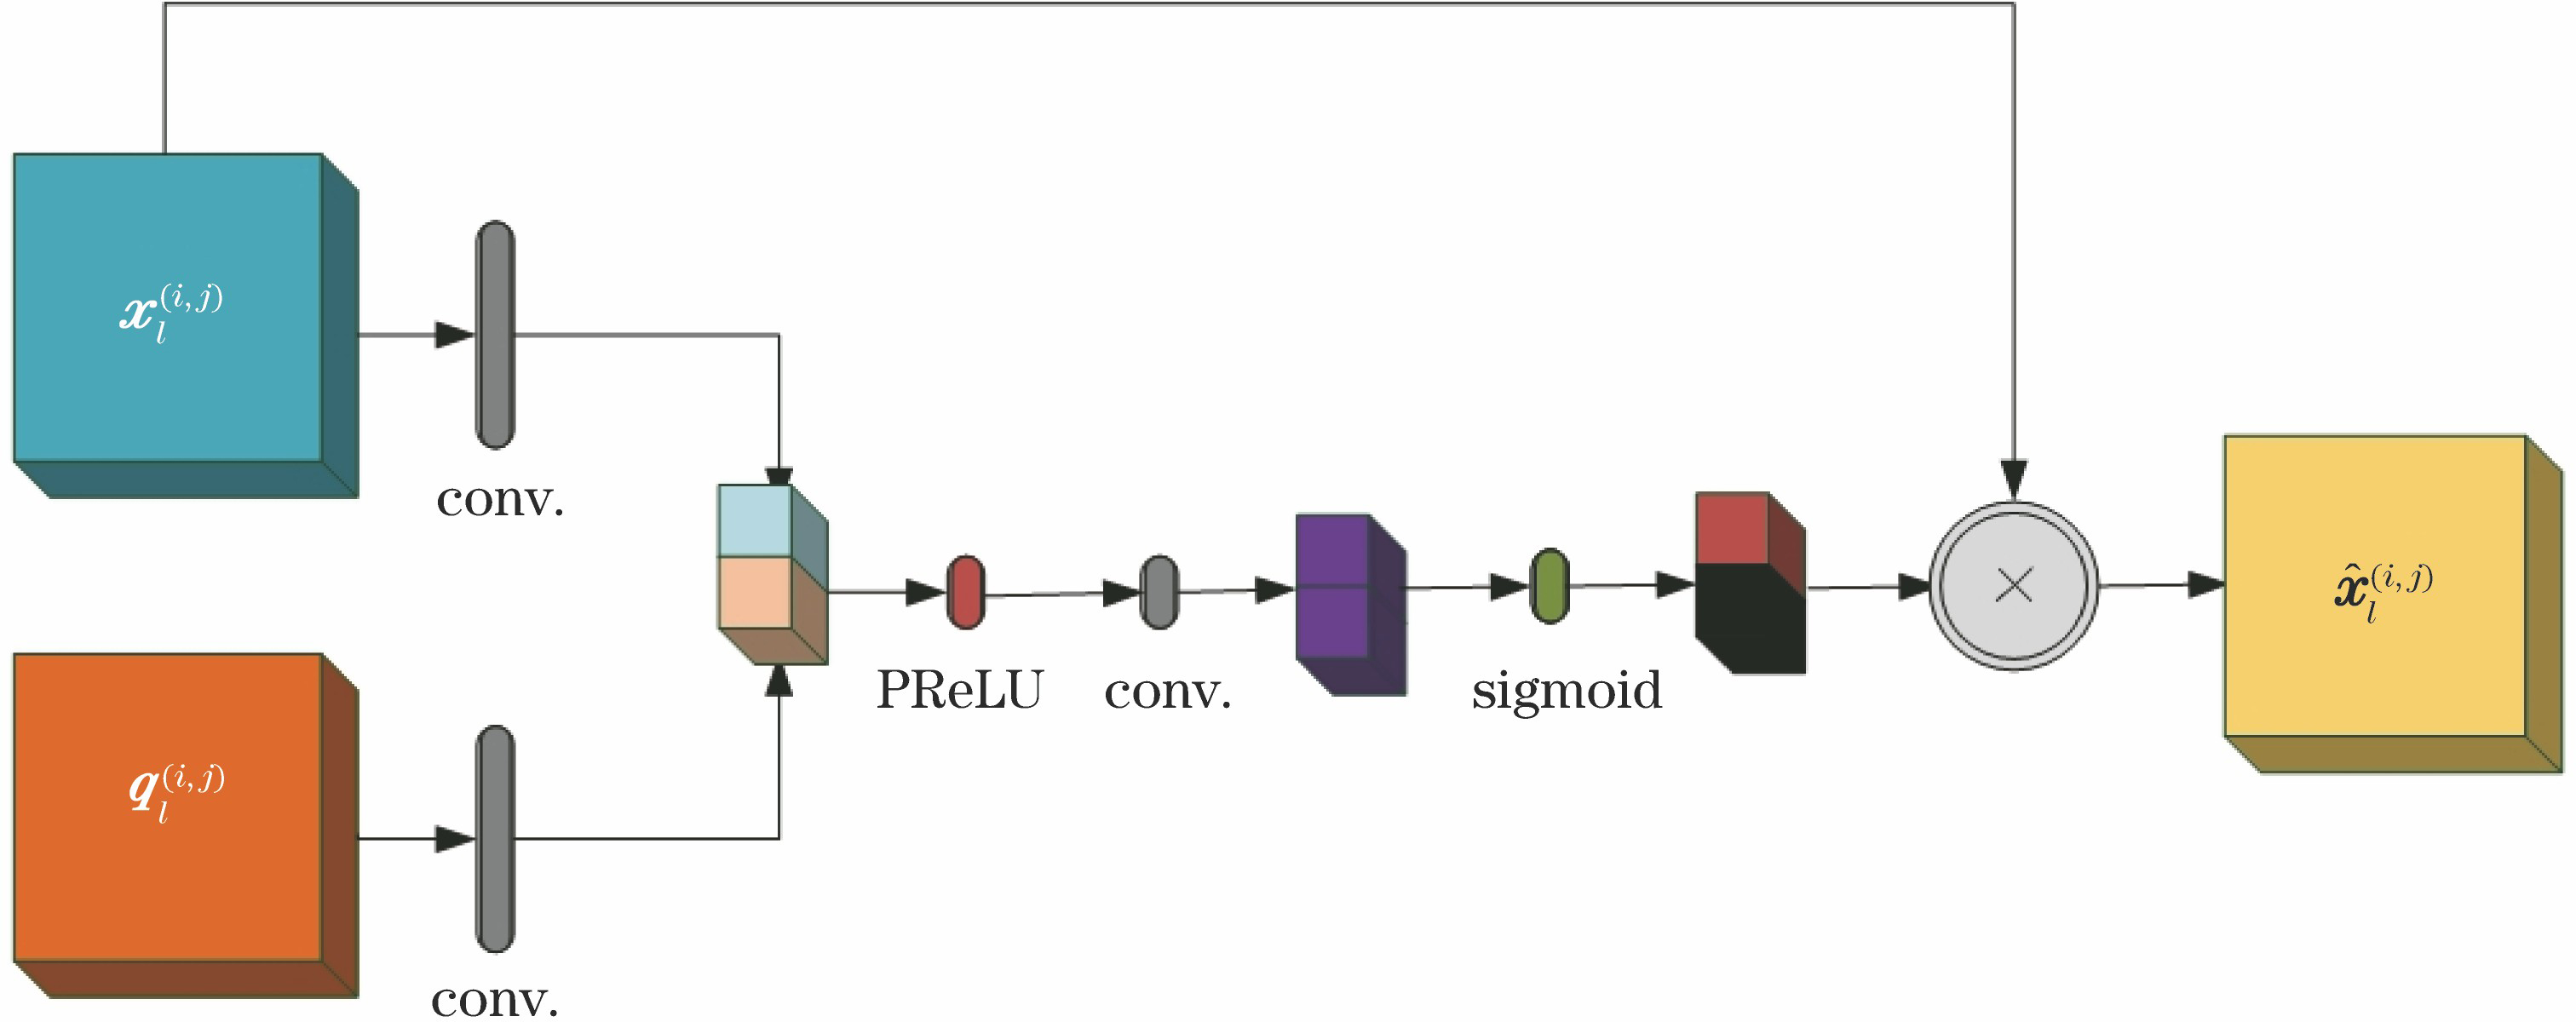
Fig. 2. Attention module schematic
Fig. 3. AttR2U-Net network structure diagram
Fig. 4. Database partial images. (a) Original image; (b) human manual segmentation figure 1; (c) human manual segmentation figure 2; (d) mask
Fig. 5. Color image sub-channel maps. (a) RGB original image; (b) red channel; (c) green channel; (d) blue channel
Fig. 6. Local sample block. (a) Training local sample block; (b) ground truth local sample block
Fig. 7. DRIVE database segmentation results. (a) Original images; (b) ground truth images; (c) segmentation result images
Fig. 8. STARE database segmentation results. (a) Original images; (b) ground truth images; (c) segmentation result images
Fig. 9. Segmentation results. (a) Img255 image; (b) ground truth images; (c) U-Net segmentation result; (d) AttR2U-Net segmentation result; (e) img255 local image; (f) local ground truth images; (g) U-Net local segmentation results; (h) AttR2U-Net local segmentation result
Assessment index | Formula |
---|
AC | | SE | | SP | | F1-score | |
|
Table 1. Standard formulas for evaluation parameters
Database | Method | AC | SE | SP | AUC |
---|
DRIVE | 2nd Human observer | 0.9472 | 0.7760 | 0.9724 | — | Ours method | 0.9689 | 0.8028 | 0.9865 | 0.9841 | STARE | 2nd Human observer | 0.9349 | 0.8968 | 0.9384 | — | Ours method | 0.9796 | 0.8227 | 0.9926 | 0.9865 |
|
Table 2. AttR2U-Net segmentation performance results
Method | AC | SE | SP | F1 | AUC |
---|
N1 | 0.9533 | 0.7722 | 0.9803 | 0.8200 | 0.9782 | N2 | 0.9563 | 0.7829 | 0.9815 | 0.8197 | 0.9776 | N3 | 0.9587 | 0.7846 | 0.9813 | 0.8240 | 0.9819 | N4 | 0.9689 | 0.8028 | 0.9865 | 0.8317 | 0.9841 |
|
Table 3. Performance comparison of different algorithms based on U-Net networks
Type | Method | Year | AC | SE | SP | F1-score | AUC |
---|
Unsupervised method | Lam et al.[23] | 2010 | 0.9472 | — | — | — | 0.9614 | Fraz et al.[24] | 2011 | 0.9430 | 0.7152 | 0.9759 | — | — | You et al.[25] | 2011 | 0.9434 | 0.7410 | 0.9751 | — | — | Azzopardi et al.[26] | 2015 | 0.9442 | 0.7655 | 0.9704 | — | 0.9614 | Supervised method | Marín et al.[27] | 2011 | 0.9452 | 0.7067 | 0.9801 | — | 0.9558 | Fraz et al.[11] | 2012 | 0.9480 | 0.7406 | 0.9807 | — | 0.9747 | Roychowdhury et al.[28] | 2016 | 0.9520 | 0.7250 | 0.9830 | — | 0.9620 | Liskowski et al.[29] | 2016 | 0.9495 | 0.7763 | 0.9768 | — | 0.9720 | Li et al.[30] | 2016 | 0.9527 | 0.7569 | 0.9816 | — | 0.9738 | U-Net[14] | 2018 | 0.9531 | 0.7537 | 0.9820 | 0.8142 | 0.9755 | AttR2U-Net(ours) | 2019 | 0.9689 | 0.8028 | 0.9865 | 0.8317 | 0.9841 |
|
Table 4. Performance indicators of different algorithms in the DRIVE database
Type | Method | Year | AC | SE | SP | F1-score | AUC |
---|
Unsupervised method | Lam et al.[23] | 2010 | 0.9567 | — | — | — | 0.9739 | Fraz et al.[24] | 2011 | 0.9442 | 0.7311 | 0.9680 | — | — | You et al.[25] | 2011 | 0.9497 | 0.7260 | 0.9756 | — | — | Azzopardi et al.[26] | 2015 | 0.9563 | 0.7716 | 0.9701 | — | 0.9497 | Supervised method | Marín et al.[27] | 2011 | 0.9520 | 0.6940 | 0.9770 | — | 0.9820 | Fraz et al.[11] | 2012 | 0.9534 | 0.7548 | 0.9763 | — | 0.9768 | Roychowdhury et al.[28] | 2016 | 0.9510 | 0.7720 | 0.9730 | — | 0.9690 | Liskowski et al.[29] | 2016 | 0.9566 | 0.7867 | 0.9754 | — | 0.9785 | Li et al.[30] | 2016 | 0.9628 | 0.7726 | 0.9844 | — | 0.9879 | U-Net[14] | 2018 | 0.9690 | 0.8270 | 0.9842 | 0.8373 | 0.9898 | AttR2U-Net(ours) | 2019 | 0.9796 | 0.8227 | 0.9926 | 0.8604 | 0.9865 |
|
Table 5. Performance indicators of different algorithms in STARE database