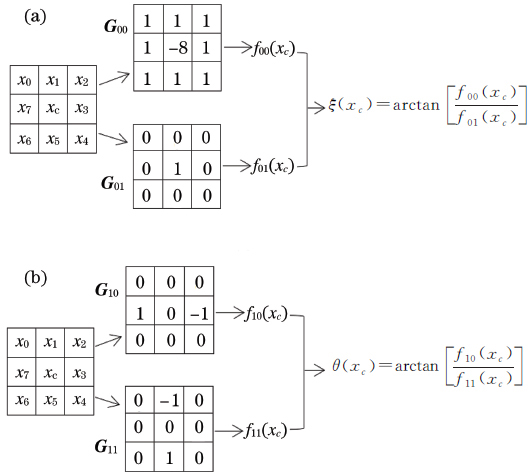
Fig. 1. Computation of differential excitation and gradient orientation. (a) Differential excitation; (b) gradient orientation
Fig. 2. Illustration of construction of 2D WLD features
Fig. 3. Orientation values of different pixels
Fig. 4. Gabor filter with 5 scales and 6 orientations
Fig. 5. Energy maps and orientation maps of a plamprint image. (a) Energy maps; (b) orientation maps
Fig. 6. Differential excitation values of different pixels
Fig. 7. Differential excitation of energy maps at different scales. (a) v=0;(b) v=1;(c) v=2;(d) v=3;(e) v=4
Fig. 8. Process of MGOWLD feature extraction
Fig. 9. Examples of palmprint images collected from different palmprint databases. (a) PolyU;(b) Blue;(c) Green;(d) Red;(e) NIR;(f) CASIA
Fig. 10. ROIs of palmprint images
Fig. 11. IR of different palmprint recognition methods. (a) PolyU;(b) Blue;(c) Green;(d) Red;(e) NIR;(f) CASIA
Fig. 12. Distributions of matching scores on different palmprint databases. (a) Blue;(b) Green; (c) Red;(d) NIR;(e) PolyU;(f) CASIA
Fig. 13. ROC curves of different methods. (a) Blue;(b) Green;(c) Red;(d) NIR;(e) PolyU;(f) CASIA
Fig. 14. Palmprint images with different levels of Gaussian noise. (a) Variance is 10;(b) variance is 20; (c) variance is 30;(d) variance is 60;(e) variance is 80;(f) variance is 100
Fig. 15. Energy maps of noisy palmprint image. (a) NIR palmprint images;(b) CASIA palmprint images
Input:palmprint image IOutput:feature vector F |
---|
1. Utilize Eq.(13)--Eq.(16) to generate Gabor filters Gu,v with V scales and U orientations2. Image I is filtered by Gu,v,and utilize Eq.(18)--Eq.(19) to generate energy maps Ev and orientation maps Ov3. Following operations are performed on energy maps and orientation maps of each scale: 3.1 Ev and Ov are divided into N non-overlapping regions,and each region is recorded as and ,respectively 3.2 Utilize Eq.(21)--Eq.(24) to calculate differential excitation ξ for each 3.3 Obtain statistics of feature histogram for each differential excitation ξ and orientation 3.4 Each column of is connected to form one-dimensional feature vector fn 3.5 Concatenate the feature vector fn of each block to form vector Fv= as the feature of scale v4. Feature vectors Fv of all scales are connected to form the feature vector F= |
|
Table 1. Steps of MGOWLD feature extraction
| MGOWLD | LBP | ALDC_A | ALDC_M | HOG | LDDBP | DOC | HOC | LWLD | AWASTP |
---|
Blue | 0.0272 | 3.1111 | 0.5661 | 0.5556 | 0.8036 | 0.2444 | 2.6054 | 1.8762 | 0.1778 | 4.0057 | Green | 0.0667 | 8.4188 | 0.6000 | 0.5778 | 1.1333 | 0.3778 | 2.6360 | 2.0667 | 0.1803 | 5.3333 | Red | 0.0444 | 3.6944 | 0.5890 | 0.5885 | 0.8895 | 0.2667 | 2.0295 | 1.6071 | 0.4667 | 5.1549 | NIR | 0.0461 | 4.6135 | 1.0415 | 1.0444 | 1.7260 | 0.3847 | 2.1487 | 1.8205 | 0.6629 | 5.1773 | PolyU | 0.1594 | 16.7197 | 1.6341 | 1.6939 | 3.5336 | 1.0761 | 4.8219 | 4.1405 | 0.8504 | 12.1125 | CASIA | 1.4887 | 8.7061 | 8.9968 | 8.5319 | 4.8199 | 2.6838 | 8.1119 | 10.6451 | 5.7985 | 5.6311 |
|
Table 2. EER of different palmprint recognition methods unit: %
Variance | 0 | 10 | 20 | 30 | 60 | 80 | 100 |
---|
Blue | 100 | 100 | 99.97 | 100 | 99.87 | 99.80 | 99.47 | Green | 99.97 | 99.93 | 99.90 | 99.90 | 99.77 | 99.43 | 99.20 | Red | 100 | 99.77 | 99.67 | 99.03 | 97.90 | 96.30 | 93.37 | NIR | 100 | 99.73 | 99.20 | 98.30 | 90.10 | 82.30 | 73.83 | PolyU | 99.88 | 99.86 | 99.86 | 99.88 | 99.88 | 99.86 | 99.84 | CASIA | 98.32 | 96.50 | 95.40 | 93.92 | 89.84 | 86.73 | 83.95 |
|
Table 3. IR of MGOWLD under different degrees of noise pollution unit: %
Variance | 0 | 10 | 20 | 30 | 60 | 80 | 100 |
---|
Blue | 0.0272 | 0.0457 | 0.0654 | 0.0849 | 0.2000 | 0.2222 | 0.3193 | Green | 0.0667 | 0.0889 | 0.1436 | 0.1704 | 0.2310 | 0.2889 | 0.4498 | Red | 0.0444 | 0.2172 | 0.2667 | 0.4080 | 0.8581 | 1.1568 | 1.5556 | NIR | 0.0461 | 0.2495 | 0.3778 | 0.7111 | 2.0498 | 3.1173 | 4.3846 | PolyU | 0.1594 | 0.1993 | 0.2050 | 0.2192 | 0.2391 | 0.3310 | 0.3384 | CASIA | 1.4887 | 2.5133 | 3.0454 | 3.2362 | 4.5227 | 5.5617 | 6.0003 |
|
Table 4. EER of MGOWLD under different degrees of noise pollution unit: %
Database | PCANet | PalmNet | MGOWLD |
---|
IR | EER | IR | EER | IR | EER |
---|
Blue | 100 | 0.0014 | 86.30 | 13.3932 | 100 | 0.0004 | Green | 100 | 0.0032 | 93.70 | 6.3000 | 100 | 0.0078 | Red | 100 | 0.0910 | 86.40 | 11.3795 | 100 | 0.1000 | NIR | 100 | 0.0215 | 87.20 | 11.6880 | 100 | 0.0083 | PolyU | 99.80 | 0.2000 | 90.20 | 9.9066 | 99.80 | 0.1940 | CASIA | 95.70 | 2.8340 | 73.00 | 23.1894 | 98.70 | 1.4145 |
|
Table 5. IR and EER of three palmprint recognition methods on different databases unit: %
Method | Feature extract | Feature matching | Total time |
---|
MGOWLD | 0.560 | 0.052 | 0.612 | PCANet | 0.430 | 6.580 | 7.010 | PalmNet | 0.750 | 6.150 | 6.900 |
|
Table 6. Time cost of different palmprint recognition methods unit: s