• Spectroscopy and Spectral Analysis
  • Vol. 42, Issue 3, 940 (2022)
Xiao-yan ZHANG*, Xue-hui HOU, Meng WANG, Li-li WANG*;, and Feng LIU*;
Author Affiliations
  • Institute of Agricultural Information and Economics, Shandong Academy of Agricultural Sciences, Jinan 250100, China
  • show less
    DOI: 10.3964/j.issn.1000-0593(2022)03-0940-07 Cite this Article
    Xiao-yan ZHANG, Xue-hui HOU, Meng WANG, Li-li WANG, Feng LIU. Study on Relationship Between Photosynthetic Rate and Hyperspectral Indexes of Wheat Under Stripe Rust Stress[J]. Spectroscopy and Spectral Analysis, 2022, 42(3): 940 Copy Citation Text show less
    Design of test area
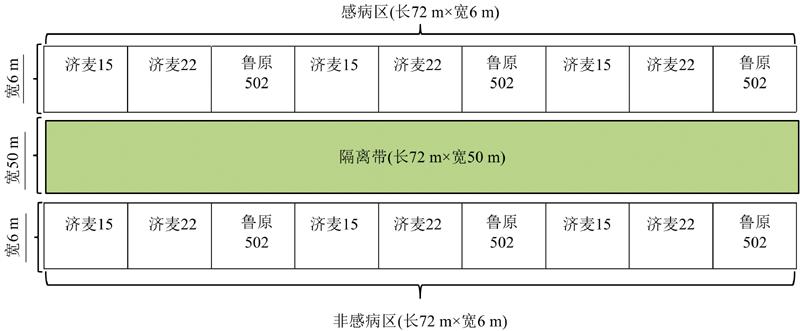
    Fig. 1. Design of test area
    Comparison of netphotosynthetic rates of wheat during flowering period
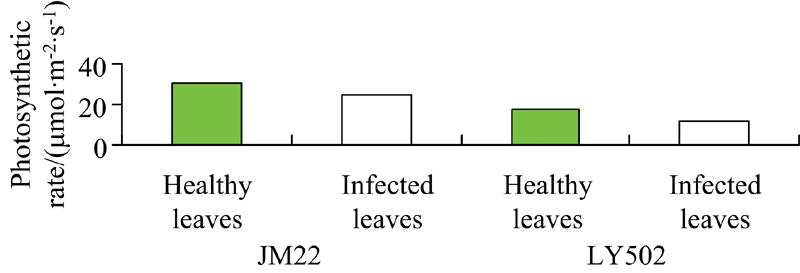
    Fig. 2. Comparison of netphotosynthetic rates of wheat during flowering period
    Comparison of spectral reflectances between healthy and diseased parts in Luyuan 502, Jimai 22 and control
    Fig. 3. Comparison of spectral reflectances between healthy and diseased parts in Luyuan 502, Jimai 22 and control
    Correlations between photosynthesis and spectral reflectance of wheat during grain filling period(a) and milk-ripe period (b)
    Fig. 4. Correlations between photosynthesis and spectral reflectance of wheat during grain filling period
    (a) and milk-ripe period (b)
    Variation of photosynthetic rate with disease index
    Fig. 5. Variation of photosynthetic rate with disease index
    光谱
    参数
    名称公式参考
    文献
    RVI比值植被指数R890/R670[10]
    PRI光化学反射指数(R570-R531)/(R570+R531)[11]
    PSRI植被衰减指数(R680-R500)/R750[12]
    Table 1. List of hyperspectral parameters
    生育
    时期
    植被指数CKLY502JM22
    正常病斑变化率/%正常病斑变化率/%正常病斑变化率/%
    光化学反射指数(PRI)0.0670.07511.9850.0630.07925.6540.0640.07314.488
    抽穗期植被衰减指数(PSRI)-0.0070.195-2 932.241-0.0140.093-767.632-0.0030.120-3 696.717
    比值植被指数(RVI)5.2202.625-49.7034.5881.624-64.5994.2171.961-53.484
    光化学反射指数(PRI)0.0330.088165.9590.0680.10452.0620.0170.116577.593
    开花期植被衰减指数(PSRI)0.0040.2176 008.5300.0000.06816 763.491-0.0290.099-445.024
    比值植被指数(RVI)4.0151.297-67.6974.7932.640-44.9118.9372.825-68.393
    光化学反射指数(PRI)0.0770.13169.5810.0460.096107.7980.0350.147316.813
    灌浆期植被衰减指数(PSRI)0.0310.210579.788-0.0100.114-1 260.853-0.0280.224-890.043
    比值植被指数(RVI)3.3131.329-59.8805.0411.369-72.8466.9872.047-70.706
    光化学反射指数(PRI)0.0350.144316.9240.0370.142281.7070.0380.138263.449
    乳熟期植被衰减指数(PSRI)0.0040.2325 336.592-0.0340.214-724.544-0.0570.358-728.083
    比值植被指数(RVI)4.9531.865-62.3473.6531.408-61.4523.4951.613-53.844
    Table 2. Comparison of spectral vegetation indexes between healthy and diseased parts of wheat flag leaves
    生育时期品种植被指数模型R2
    抽穗期光化学反射指数(PRI)y=5 846.0x2-711.60x+37.430.914**
    CK植被衰减指数(PSRI)y=-76 960x3-16 153x2-7.90x+17.910.446
    比值植被指数(RVI)y=4.128x3-68.02x2+369.9x-647.20.982**
    光化学反射指数(PRI)y=51 426x2-6 343x+220.30.614
    JM22植被衰减指数(PSRI)y=19 716x3+5 157x2-110.8x+26.760.385
    比值植被指数(RVI)y=-16.25x3+208.3x2-868.5x+1 1970.889**
    光化学反射指数(PRI)y=-1 037x2+136x+13.620.018
    LY502植被衰减指数(PSRI)y=-6 182x2-103.7x+18.130.542
    比值植被指数(RVI)y=-0.48x2+4.282x+8.7090.516
    扬花期光化学反射指数(PRI)y=3×107x3-3×106x2+92 373.0x-959.10.911**
    CK植被衰减指数(PSRI)y=16 040x2-115.8x+16.710.685
    比值植被指数(RVI)y=3.549x2-29.19x+77.320.154
    光化学反射指数(PRI)y=87.55x+16.160.942**
    JM22植被衰减指数(PSRI)y=119.2x+21.110.822*
    比值植被指数(RVI)y=0.679x2-11.41x+64.480.975**
    光化学反射指数(PRI)y=879.1x2-79.49x+16.390.992**
    LY502植被衰减指数(PSRI)y=30 811x3-3 565x2-143.6x+17.070.999**
    比值植被指数(RVI)y=1.368x2-14.310x+52.10.812*
    灌浆期光化学反射指数(PRI)y=-1 624x2+315.7x-0.9270.850*
    CK植被衰减指数(PSRI)y=-378.4x2+72.52x+11.480.992**
    比值植被指数(RVI)y=-0.283x+12.960.674
    光化学反射指数(PRI)y=-67 648x3+6 588x2-182.5x+25.490.892**
    JM22植被衰减指数(PSRI)y=-4 028x2-232.6x+21.280.799**
    比值植被指数(RVI)y=6.802x3-145x2+1 029x-2 4090.453
    光化学反射指数(PRI)y=-1×+107x3+2×106x2-81 017x+1 2080.543
    LY502植被衰减指数(PSRI)y=56 186x3-4 964x2-403.9x+25.380.745*
    比值植被指数(RVI)y=3.914x2-38.36x+113.90.684
    乳熟期光化学反射指数(PRI)y=-6 537x2+483.1x+0.0580.683
    CK植被衰减指数(PSRI)y=90 000x3-9 628x2-159.7x+8.290.558
    比值植被指数(RVI)y=-35.37x3+514.4x2-2 481x+3 9760.369
    光化学反射指数(PRI)y=-182.1x+15.570.855*
    JM22植被衰减指数(PSRI)y=18 482x2+2 041x+64.330.703*
    比值植被指数(RVI)y=57.67x2-404.4x+716.30.881*
    光化学反射指数(PRI)y=72 512x2-5 243x+100.20.784*
    LY502植被衰减指数(PSRI)y=8 251x2+508.3x+13.470.733*
    比值植被指数(RVI)y=-6.779x2+49.46x-81.370.545
    Table 3. Photosynthetic rate inversion models by vegetation indexes for different varieties of wheat in different periods (n=180)
    Xiao-yan ZHANG, Xue-hui HOU, Meng WANG, Li-li WANG, Feng LIU. Study on Relationship Between Photosynthetic Rate and Hyperspectral Indexes of Wheat Under Stripe Rust Stress[J]. Spectroscopy and Spectral Analysis, 2022, 42(3): 940
    Download Citation