
Qing-sheng LIU, De-wang YANG, Jin-jia GUO, Ao-shuang YAN, Rong-er ZHENG. Raman Spectroscopy for Gas Detection Using a Folded Near-Concentric Cavity[J]. Spectroscopy and Spectral Analysis, 2020, 40(11): 3390
- Spectroscopy and Spectral Analysis
- Vol. 40, Issue 11, 3390 (2020)
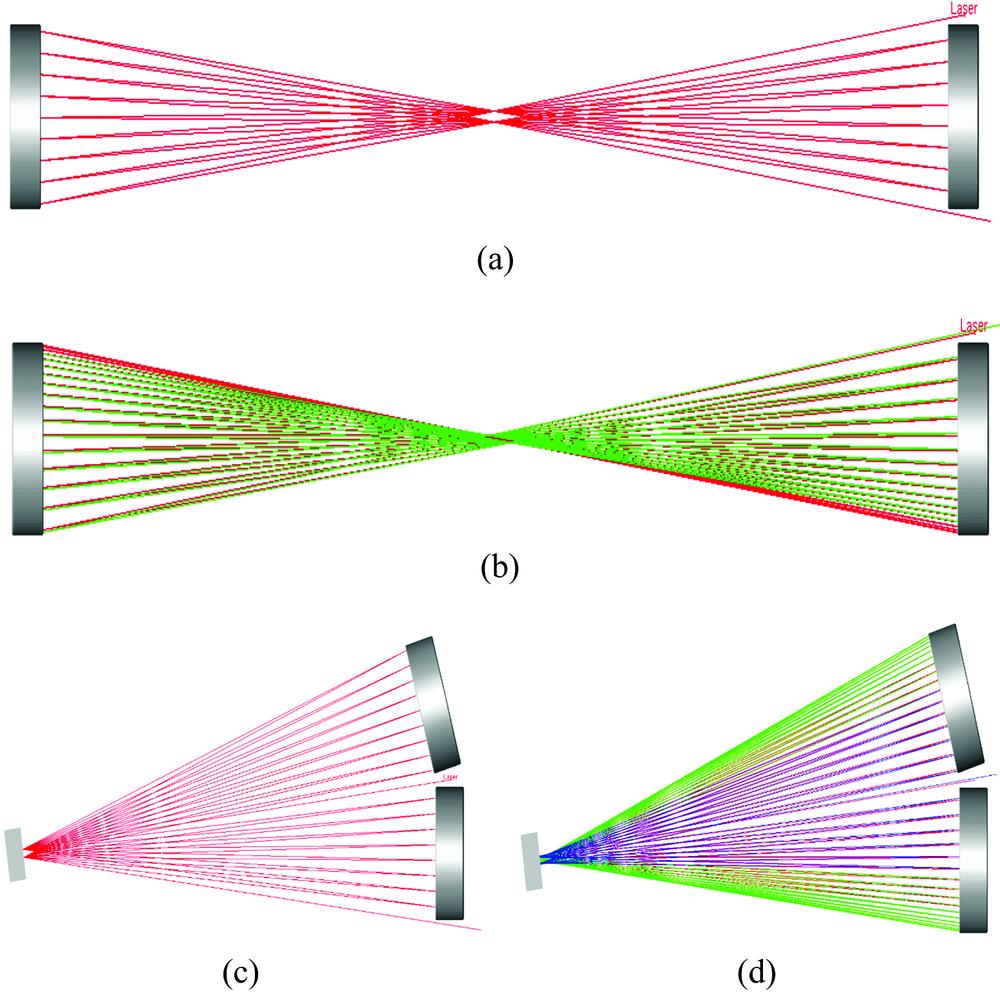
Fig. 1. Light distribution of different reflection mode
(a): Concentric cavity; (b): Near concentric cavity;(c): Fold concentric cavity; (d): Fold near concentric cavity The different colors represent the different light energy 100%≥red≥66.6%, 66.6%>green≥33.3%, 33.3%>blue≥25%
(a): Concentric cavity; (b): Near concentric cavity;(c): Fold concentric cavity; (d): Fold near concentric cavity The different colors represent the different light energy 100%≥red≥66.6%, 66.6%>green≥33.3%, 33.3%>blue≥25%
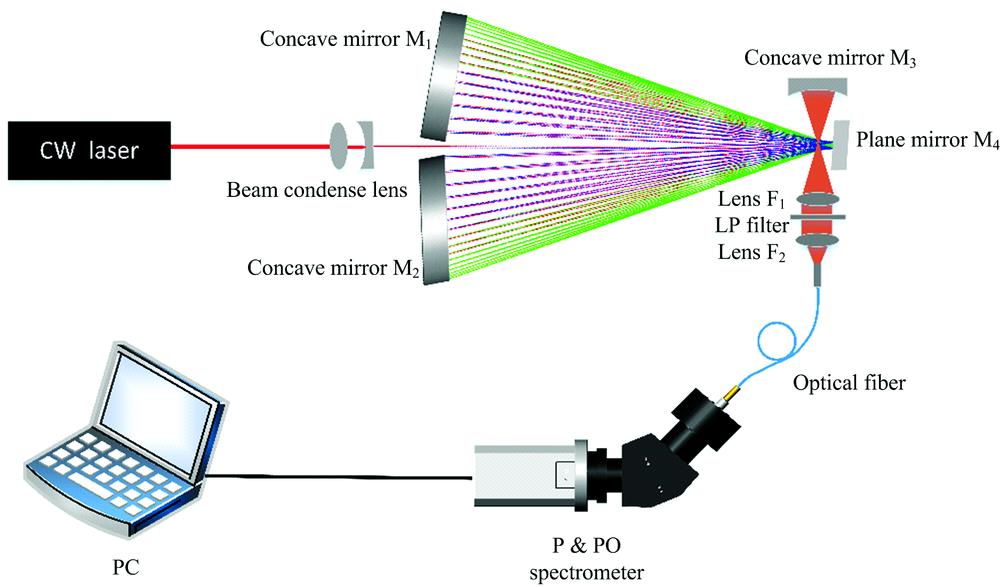
Fig. 2. Schematic diagram of the fold near concentric cavity enhanced Raman signal experimental setup
Fig. 3. Photograph of the experimental apparatus
(a): Fold near concentric mode; (b): Fold concentric mode
(a): Fold near concentric mode; (b): Fold concentric mode
Fig. 4. Experimental results comparison between different working mode of concentric cavity, near concentric cavity, fold concentric cavity, fold near concentric cavity and single pass
Fig. 5. Raman spectra of O2 and CO2 based on the different cavity mode and single pass mode
|
Table 1. Signal intensity and SNR comparison between different mode for N2

Set citation alerts for the article
Please enter your email address
© Copyright 2018-2021 | Chinese Laser Press. All Rights Reserved 沪ICP备15018463号-20