
Xiao-yu CHEN, kun ZHANG, De-ming KONG. Three-Dimensional Fluorescence Partial Derivative Spectroscopy Combined With Parallel Factor Algorithm for Detection of Mixed Oil[J]. Spectroscopy and Spectral Analysis, 2021, 41(11): 3506
- Spectroscopy and Spectral Analysis
- Vol. 41, Issue 11, 3506 (2021)
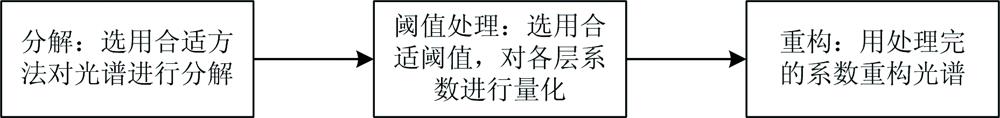
Fig. 1. Wavelet threshold denoising algorithm
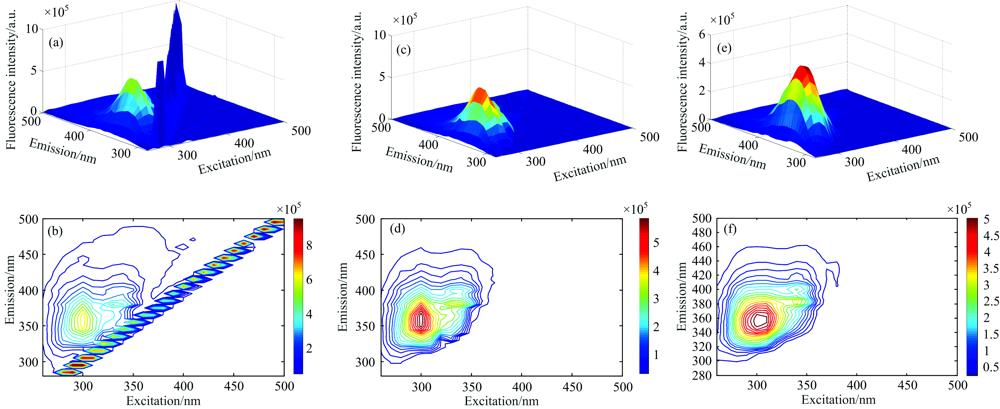
Fig. 2. The three-dimensional fluorescence spectrum and contour map of sample 5 before and after removing the scattering
(a): Three-dimensional fluorescence spectrum with scattering; (b): Contour map with scattering;(c): Three-dimensional fluorescence spectrum after removing the scattering; (d) Contour map after removing scattering;(e): Three-dimensional fluorescence spectrum after wavelet denoising; (f): Contour map after wavelet denoising
(a): Three-dimensional fluorescence spectrum with scattering; (b): Contour map with scattering;(c): Three-dimensional fluorescence spectrum after removing the scattering; (d) Contour map after removing scattering;(e): Three-dimensional fluorescence spectrum after wavelet denoising; (f): Contour map after wavelet denoising
Fig. 3. (a) Core consistency value; (b) Residual sum of squares
Fig. 4. (a)—(f)Comparison chart of analytical spectrum and standard spectrum of mixed oil;(g)—(l)Comparison of analytical spectrum and standard spectrum of jet fuel
(a): The emission spectrum of the original spectrum; (b): The excitation spectrum of the original spectrum; (c): The emission spectrum of the emission wavelength partial derivative spectrum; (d): The excitation spectrum of the emission wavelength partial derivative spectrum; (e): The emission spectrum of the excitation wavelength partial derivative spectrum; (f): The excitation spectrum of the excitation wavelength partial derivative spectrum; (g): The emission spectrum of the original spectrum; (h): The excitation spectrum of the original spectrum; (i): The emission spectrum of the emission wavelength partial derivative spectrum; (j): The excitation spectrum of the emission wavelength partial derivative spectrum; (k): The emission spectrum of the excitation wavelength partial derivative spectrum; (l): The excitation spectrum of the excitation wavelength partial derivative spectrum
(a): The emission spectrum of the original spectrum; (b): The excitation spectrum of the original spectrum; (c): The emission spectrum of the emission wavelength partial derivative spectrum; (d): The excitation spectrum of the emission wavelength partial derivative spectrum; (e): The emission spectrum of the excitation wavelength partial derivative spectrum; (f): The excitation spectrum of the excitation wavelength partial derivative spectrum; (g): The emission spectrum of the original spectrum; (h): The excitation spectrum of the original spectrum; (i): The emission spectrum of the emission wavelength partial derivative spectrum; (j): The excitation spectrum of the emission wavelength partial derivative spectrum; (k): The emission spectrum of the excitation wavelength partial derivative spectrum; (l): The excitation spectrum of the excitation wavelength partial derivative spectrum
| ||||||||||||||||||||||||||||||||||||||||||||||||||||||||
Table 1. Correlation coefficient and root mean square error between analytical spectrum and standard spectrum
| |||||||||||||||||||||||||||||
Table 2. Correlation coefficient and root mean square error between analytical spectrum and standard spectrum

Set citation alerts for the article
Please enter your email address
© Copyright 2018-2021 | Chinese Laser Press. All Rights Reserved 沪ICP备15018463号-20