
Yandi Li, Xiping Xu. Human Action Recognition by Decision-Making Level Fusion Based on Spatial-Temporal Features[J]. Acta Optica Sinica, 2018, 38(8): 0810001
- Acta Optica Sinica
- Vol. 38, Issue 8, 0810001 (2018)
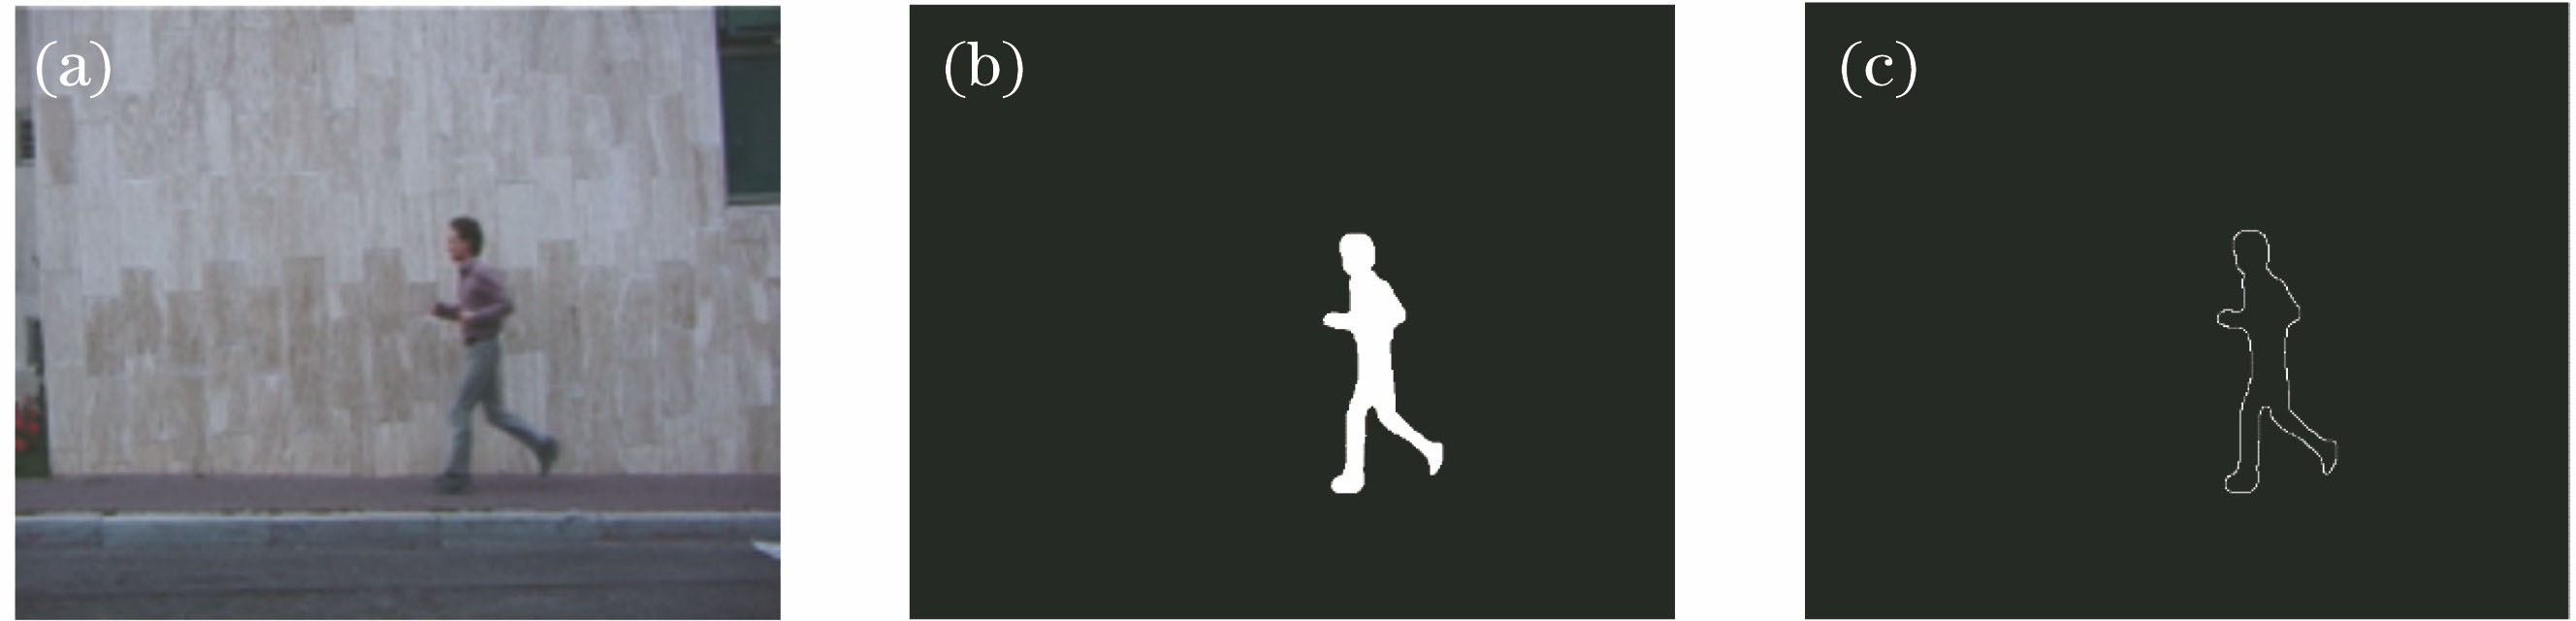
Fig. 1. Target contour extraction process. (a) Original video; (b) motion detection; (c) target contour extraction
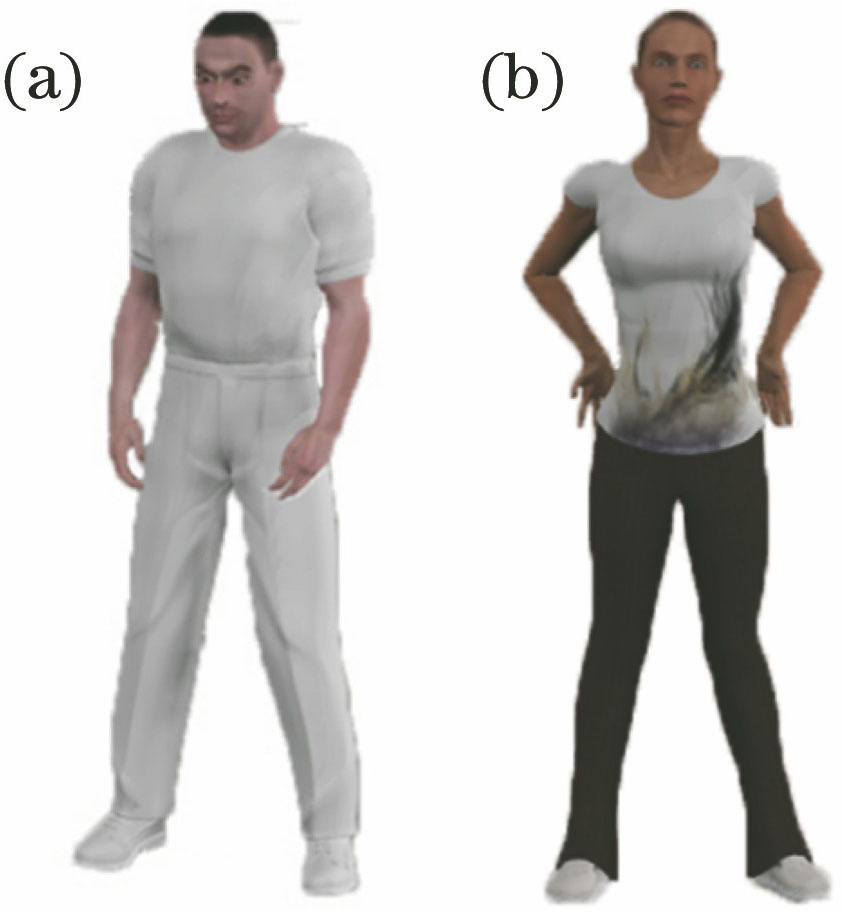
Fig. 2. (a) Template image and (b) test image of POSER 3D simulation samples
Fig. 3. Sampling results
Fig. 4. Distribution of contour points in polar coordinates
Fig. 5. Shape histogram of different contour sampling points. (a) Sampling point 1; (b) sampling point 2; (c) sampling point 3
Fig. 6. Matching results
Fig. 7. Matching results of different sampling points
Fig. 8. Video sequences
Fig. 9. Matching process of feature sequence in spatial domain
Fig. 10. Match process of feature sequence in time domain
Fig. 11. Schematic diagram of DTW algorithm
Fig. 12. Schematic of typical local path constraint
Fig. 13. Diagram of "Morbid" twisting path
Fig. 14. Schematic of parameter of elliptic band
Fig. 15. Recognition rate of different weight distributions
Fig. 16. Influence of decision threshold values on recognition rate
Fig. 17. Schematic of three global constraint boundaries with the same warping window size
Fig. 18. Comparison of searching efficiency of different bands
Fig. 19. Searching efficiency of different global boundaries on large time series
Fig. 20. Classification accuracies of different boundaries sharps and sizes
Fig. 21. Classification accuracies of all warping window sizes with different frames
Fig. 22. Confusion matrix of classification results on KTH dataset. (a) Shape feature; (b) motion feature; (c) fusion feature
Fig. 23. Confusion matrix of classification results on Weizmann dataset. (a) Shape feature; (b) motion feature; (c) fusion feature
|
Table 1. Comparison ofaccuracy and computation time of different algorithms on KTH dataset
|
Table 2. Comparison of average accuracy and computation time of different algorithms on Weizmann dataset
|
Table 3. Comparison of average accuracy of different algorithms on UCF101 dataset

Set citation alerts for the article
Please enter your email address
© Copyright 2018-2021 | Chinese Laser Press. All Rights Reserved 沪ICP备15018463号-20