
Mengnan Xu, Zengxiong Lu, Yuejing Qi, Jing Li, Jing Ma. Influence of Beam Polarization on Contrast of Self-Referencing Interference Signal[J]. Laser & Optoelectronics Progress, 2021, 58(23): 2326002
- Laser & Optoelectronics Progress
- Vol. 58, Issue 23, 2326002 (2021)
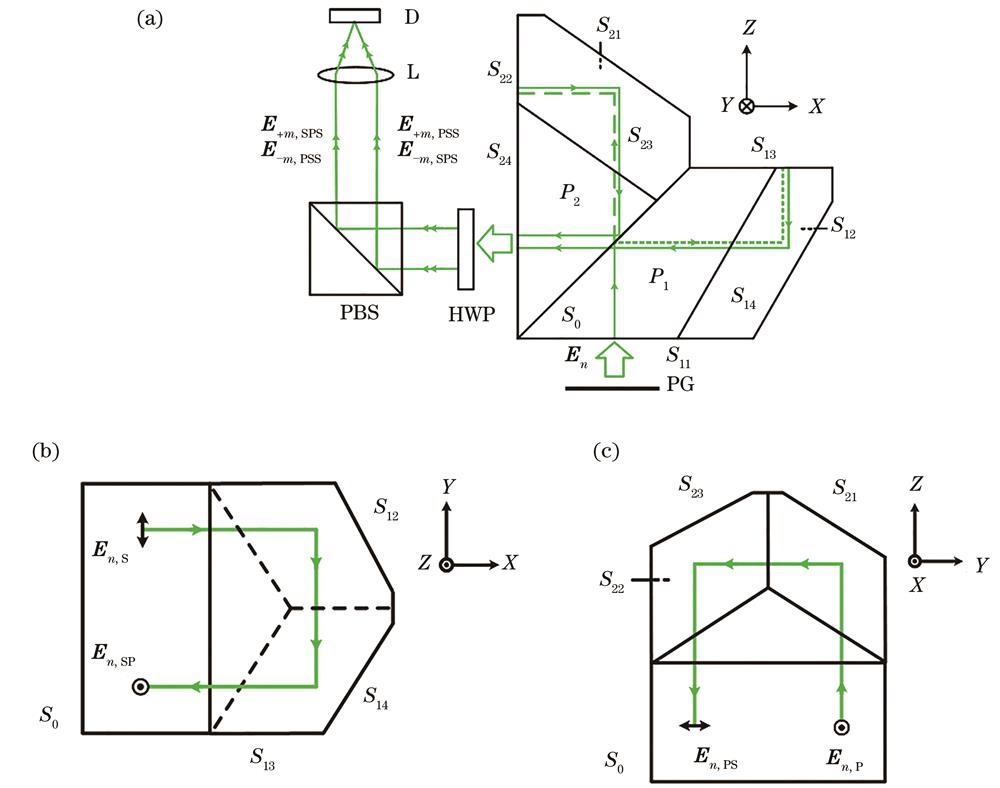
Fig. 1. Optical path of the phase grating position measurement system. (a) Optical path of the phase grating position measurement system; (b) top view of prism P1; (c) side view of prism P2
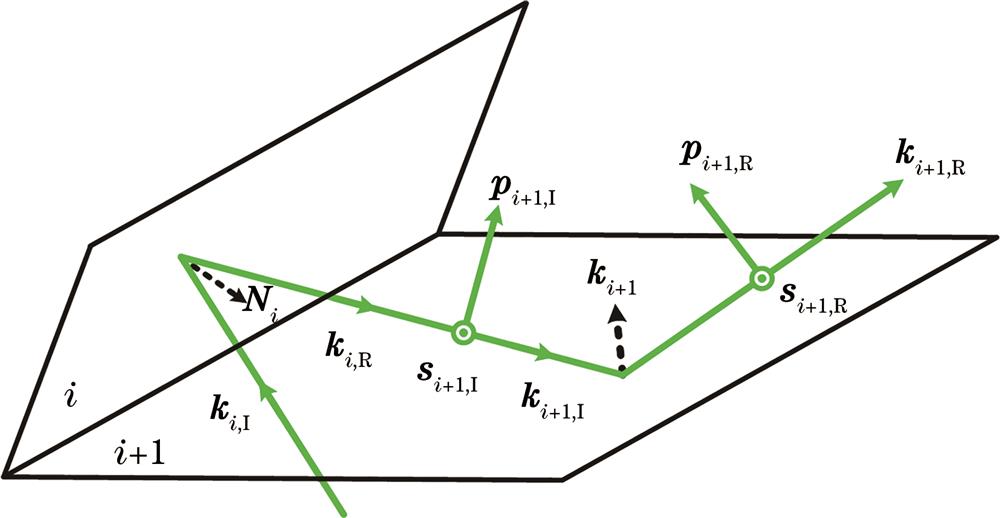
Fig. 2. Schematic diagram of light vector relationship between two adjacent reflecting surfaces in space
Fig. 3. Interference signals at different positions of the phase grating (simulation experiment). (a) Δy=-8 μm & 0 μm; (b) Δy=-7.2 μm &-0.8 μm; (c) Δy=-6.4 μm & -1.6 μm; (d) Δy=-5.6 μm & -2.4 μm; (e) Δy=-4.8 μm & -3.2 μm; (f) Δy=-4 μm
Fig. 4. Normalized interference signal on detector D under ideal conditions
Fig. 5. Influence of S0 extinction ratio on the interference signal contrast and peak intensity. (a) Signal contrast; (b) peak intensity
Fig. 6. Influence of PBS extinction ratio on interference signal contrast and peak intensity. (a) Signal contrast; (b) peak intensity
Fig. 7. Influence of the polarization state of the incident light on the contrast of the interference signal. (a) Relationship between the ellipticity and ellipse angle of the incident light and the contrast of the interference signal; (b) partial enlargement
Fig. 8. Relationship between the contrast of the interference signal and the phase difference
Fig. 9. Polarization value range of incident light with interference signal contrast greater than 0.98 under different optical path differences
Table 1. Rotation matrix between the reflective surfaces in prisms P1 and P2
| |||||||||||||||||||||||||||||||||||||||||||||||||||||||||||||||||||||||
Table 2. Contrast of interference signal between simulation experiment and theoretical model under different parameters

Set citation alerts for the article
Please enter your email address
© Copyright 2018-2021 | Chinese Laser Press. All Rights Reserved 沪ICP备15018463号-20