• Photonics Research
  • Vol. 2, Issue 1, 10 (2014)
H. Alisafaee1, J. Marmon2, and M. A. Fiddy1、3、*
Author Affiliations
  • 1Center for Optoelectronics and Optical Communications, The University of North Carolina at Charlotte, 9201 University City Blvd., Charlotte, North Carolina 28223, USA
  • 2Department of Chemistry, The University of North Carolina at Charlotte, 9201 University City Blvd., Charlotte, North Carolina 28223, USA
  • 3Department of Electrical and Computer Science, The University of North Carolina at Charlotte, 9201 University City Blvd., Charlotte, North Carolina 28223, USA
  • show less
    DOI: 10.1364/PRJ.2.000010 Cite this Article Set citation alerts
    H. Alisafaee, J. Marmon, M. A. Fiddy. Spectral properties of Au–ZnTe plasmonic nanorods[J]. Photonics Research, 2014, 2(1): 10 Copy Citation Text show less
    Extinction spectra of incident light as functions of the spacing between nanorod structures. The Au diameter is 100 nm, and the ZnTe diameter and length are 60 and 500 nm, respectively. The inset shows the unit cell of simulation.
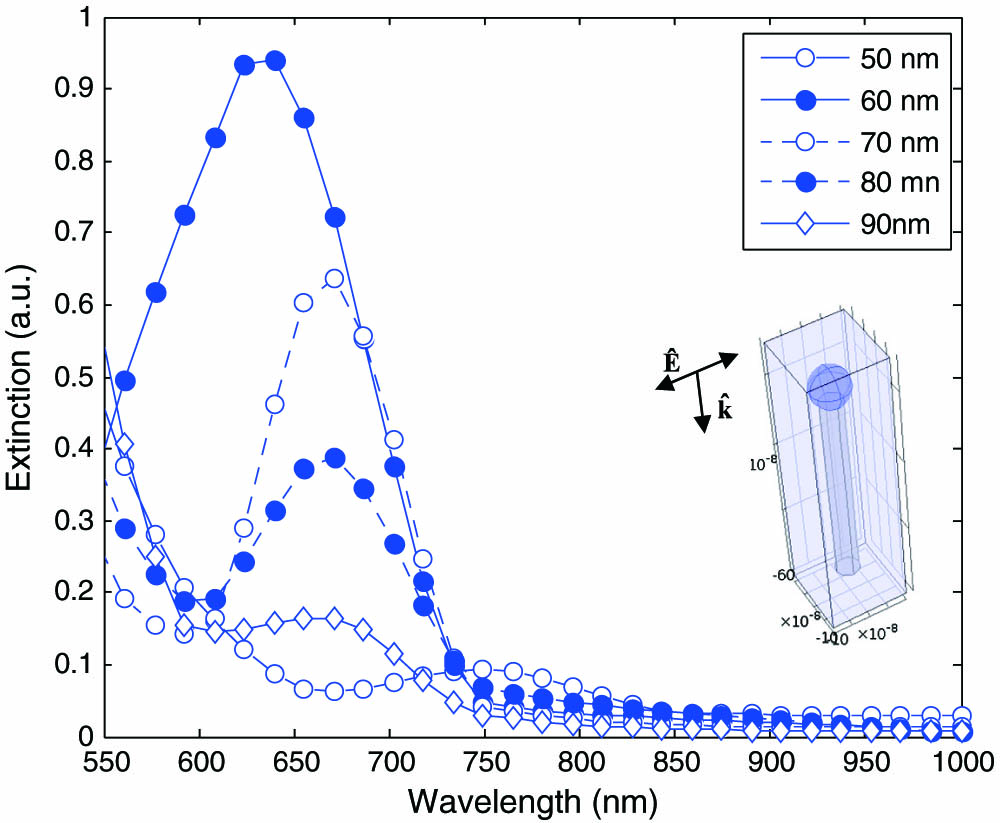
    Fig. 1. Extinction spectra of incident light as functions of the spacing between nanorod structures. The Au diameter is 100 nm, and the ZnTe diameter and length are 60 and 500 nm, respectively. The inset shows the unit cell of simulation.
    Power dissipation in the plasmonic nanorod structure as a function the light wavelength: (a) 1000 nm, (b) 750 nm, (c) 600 nm, (d) 550 nm. The neighboring nanorods are placed with a spacing of 60 nm. Scattering profiles of the Au–ZnTe element at λ=600 nm for directions (e) perpendicular and (f) parallel to the polarization plane of light.
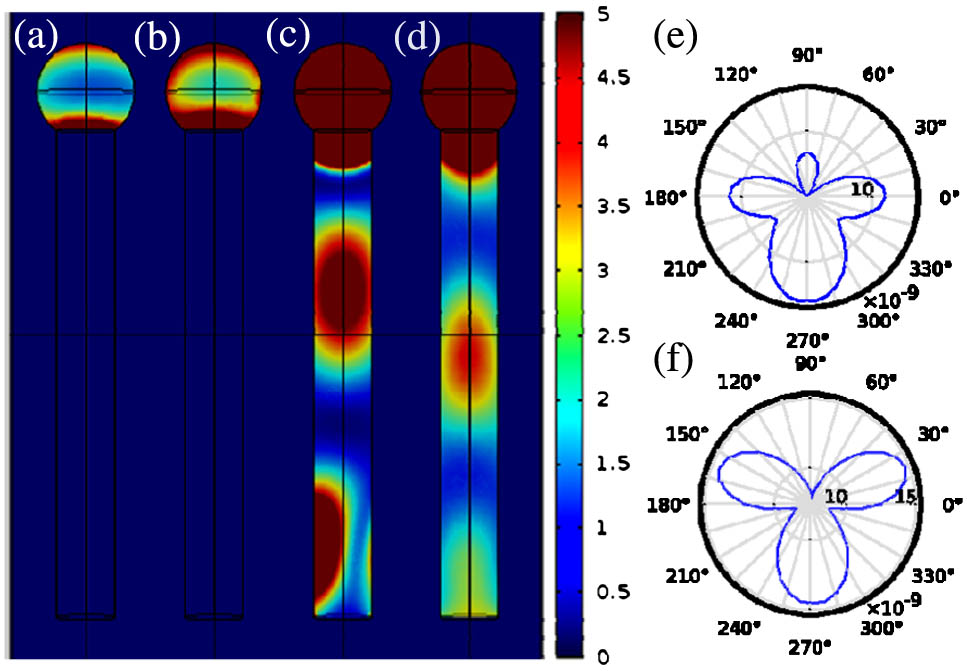
    Fig. 2. Power dissipation in the plasmonic nanorod structure as a function the light wavelength: (a) 1000 nm, (b) 750 nm, (c) 600 nm, (d) 550 nm. The neighboring nanorods are placed with a spacing of 60 nm. Scattering profiles of the Au–ZnTe element at λ=600nm for directions (e) perpendicular and (f) parallel to the polarization plane of light.
    Normalized extinction spectra as a function of nanorod length with a constant 60 nm spacing between structures.
    Fig. 3. Normalized extinction spectra as a function of nanorod length with a constant 60 nm spacing between structures.
    Power dissipation (filled) and enhancement factor (empty) versus ZnTe length at wavelengths of 600 (diamonds) and 550 nm (circles). Insets: absorption distribution at 550 (left) and 600 nm (right).
    Fig. 4. Power dissipation (filled) and enhancement factor (empty) versus ZnTe length at wavelengths of 600 (diamonds) and 550 nm (circles). Insets: absorption distribution at 550 (left) and 600 nm (right).
    (a) Schematic of Au–ZnTe array with equivalent circuit model elements and (b) calculation of the induced relative dipole moment in the gold spheres. The white line is the LSPR in air for and isolated sphere. (c) Comparison of LCR circuit response and simulation data points for a 60 nm separated array of Fig. 1.
    Fig. 5. (a) Schematic of Au–ZnTe array with equivalent circuit model elements and (b) calculation of the induced relative dipole moment in the gold spheres. The white line is the LSPR in air for and isolated sphere. (c) Comparison of LCR circuit response and simulation data points for a 60 nm separated array of Fig. 1.
    Scanning electron microscope image of the large-scale fabricated composite nanostructure. The scale bar is 10 μm. Insets show a dark field image of the Au islands (left) and selected nanostructure elements at 200 nm scale (right).
    Fig. 6. Scanning electron microscope image of the large-scale fabricated composite nanostructure. The scale bar is 10 μm. Insets show a dark field image of the Au islands (left) and selected nanostructure elements at 200 nm scale (right).
    H. Alisafaee, J. Marmon, M. A. Fiddy. Spectral properties of Au–ZnTe plasmonic nanorods[J]. Photonics Research, 2014, 2(1): 10
    Download Citation