• Spectroscopy and Spectral Analysis
  • Vol. 42, Issue 9, 2795 (2022)
Ji MA1; 2; *;, Guo-xia HUANG1; 2;, Jun-sheng LI1; 2; *;, Liu-juan YAN1; 2;, and Qian ZHANG1;
Author Affiliations
  • 1. Guangxi Key Laboratory of Green Processing of Sugar Resources, College of Biological and Chemical Engineering, Guangxi University of Science and Technology, Liuzhou 545006, China
  • show less
    DOI: 10.3964/j.issn.1000-0593(2022)09-2795-05 Cite this Article
    Ji MA, Guo-xia HUANG, Jun-sheng LI, Liu-juan YAN, Qian ZHANG. A Visual Colorimetric Method for Hydrogen Peroxide Detection Based on the Peroxidase-Like Properties of Cu(Ⅱ)[J]. Spectroscopy and Spectral Analysis, 2022, 42(9): 2795 Copy Citation Text show less
    Schematic illustration of Cu2+-H2O2-TMB colorimetric reaction (a) and colorimetric detection of H2O2 (b)
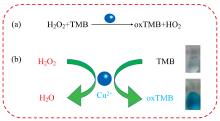
    Fig. 1. Schematic illustration of Cu2+-H2O2-TMB colorimetric reaction (a) and colorimetric detection of H2O2 (b)
    UV-Visible absorption spectra of feasibility experiment; Inset is the typical photograph of the corresponding curvea: TMB-H2O2; b: TMB-Cu2+; c: TMB-H2O2-Cu2+; cTMB=6×10⁻⁴ mol·L-1; cCu2+=8×10⁻³ mol·L-1; cH2O2=1×10⁻⁵ mol·L-1
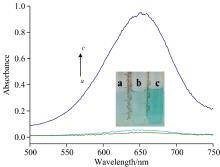
    Fig. 2. UV-Visible absorption spectra of feasibility experiment; Inset is the typical photograph of the corresponding curve
    a: TMB-H2O2; b: TMB-Cu2+; c: TMB-H2O2-Cu2+; cTMB=6×10⁻⁴ mol·L-1; cCu2+=8×10⁻³ mol·L-1; cH2O2=1×10⁻⁵ mol·L-1
    Effect of reaction timecTMB=6×10⁻⁴ mol·L-1; cCu2+=8×10⁻³ mol·L-1; cH2O2=1×10⁻⁵ mol·L-1
    Fig. 3. Effect of reaction time
    cTMB=6×10⁻⁴ mol·L-1; cCu2+=8×10⁻³ mol·L-1; cH2O2=1×10⁻⁵ mol·L-1
    UV-Vis spectraofthe Cu2+-TMB- H2O2 systemcTMB=6×10⁻⁴ mol·L-1; cCu2+=8×10⁻³ mol·L-1; a—h: the H2O2 concentrations are 0, 0.80, 2.0, 4.0, 8.0, 16, 24, 32 and 40×10-6 mol·L-1, respectively
    Fig. 4. UV-Vis spectraofthe Cu2+-TMB- H2O2 system
    cTMB=6×10⁻⁴ mol·L-1; cCu2+=8×10⁻³ mol·L-1; ah: the H2O2 concentrations are 0, 0.80, 2.0, 4.0, 8.0, 16, 24, 32 and 40×10-6 mol·L-1, respectively
    The fitted curve of A652 versus the concentration of H2O2
    Fig. 5. The fitted curve of A652 versus the concentration of H2O2
    样品起始量/
    (μmol·L-1)
    加标量/
    (μmol·L-1)
    测定值/
    (μmol·L-1)
    回收率/
    %
    相对标准偏差
    (%, n=3)
    10.3610.0010.59102.22±1.353.02
    20.3620.0019.7797.10±0.421.26
    30.3630.0032.51107.08±1.260.52
    Table 1. Result of H2O2 in tremella detected by this proposed method
    Ji MA, Guo-xia HUANG, Jun-sheng LI, Liu-juan YAN, Qian ZHANG. A Visual Colorimetric Method for Hydrogen Peroxide Detection Based on the Peroxidase-Like Properties of Cu(Ⅱ)[J]. Spectroscopy and Spectral Analysis, 2022, 42(9): 2795
    Download Citation