
Heyu Xu, Liming Zhang, Wenxin Huang, Xin Li, Xiaolong Si, Weiwei Xu, Qingjun Song. On-Board Absolute Radiometric Calibration and Validation Based on Solar Diffuser of HY-1C SCS[J]. Acta Optica Sinica, 2020, 40(9): 0928002
- Acta Optica Sinica
- Vol. 40, Issue 9, 0928002 (2020)
![Structural diagram of SCS[25]](/richHtml/gxxb/2020/40/9/0928002/img_1.jpg)
Fig. 1. Structural diagram of SCS[25]
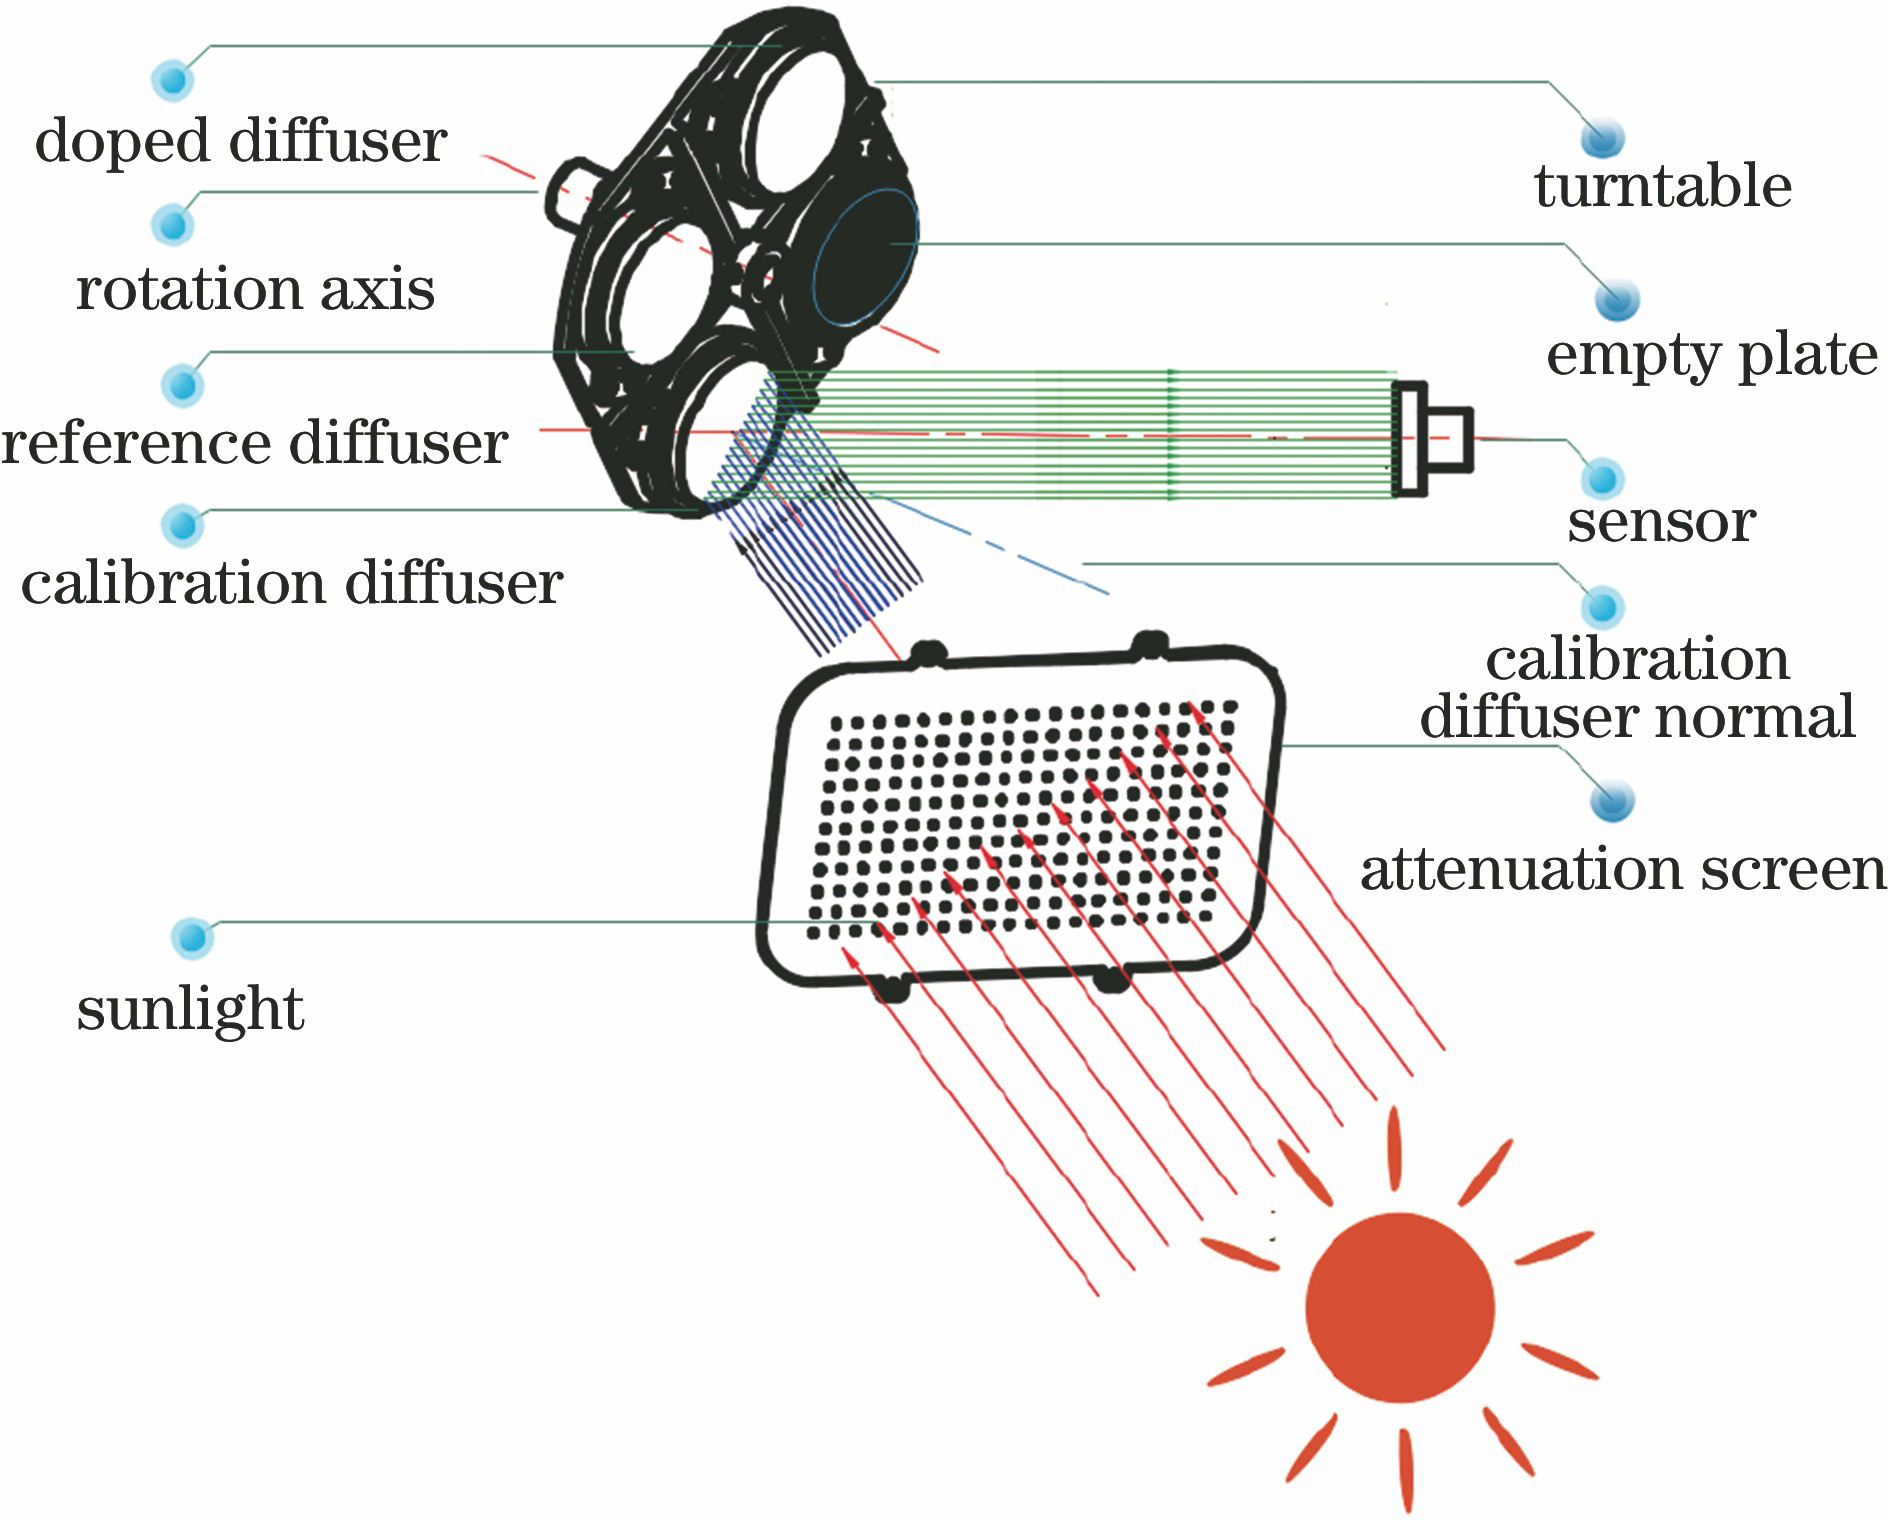
Fig. 2. Schematic of on-board calibration system
Fig. 3. Measurement results from laboratory. (a) Distribution characteristic of BRDF; (b) transmittance of attenuation screen
Fig. 4. Spectral response function of MODIS
Fig. 5. Flow chart of cross-validation
Fig. 6. Images. (a) Geometrically corrected MODIS image; (b) image of crossover region in MODIS and SCS; (c) geometrically corrected SCS image
Fig. 7. Images. (a) Resampled MODIS image; (b) uniform crossover region in MODIS and SCS; (c) geometrically corrected SCS image
Fig. 8. Data processing results. (a) Radiance of SCS; (b) cross-validation result on 2019--01--24
Fig. 9. Predicted equivalent radiance and measured equivalent radiance obtained of MODIS. (a) 2019--02--28; (b) 2019--03--13
Fig. 10. Degradation factor of calibrated solar diffuser
|
Table 1. Dynamic range of SCS and SNR
| |||||||||||||||||||||||||||||||||
Table 2. Overpass time and geometric parameters of TERRA MODIS and HY-1C SCS
| |||||||||||||||||||||||||||||||||||||||||||||||||||
Table 3. Overpass time and geometric parameters of TERRA MODIS and HY-1C SCS
| |||||||||||||||||||||||||||||||||||||||||||||||||||||||||||||||||||||||||||||||||||
Table 4. Relative deviation between measured equivalent radiance and predicted equivalent radiance

Set citation alerts for the article
Please enter your email address
© Copyright 2018-2021 | Chinese Laser Press. All Rights Reserved 沪ICP备15018463号-20