Author Affiliations
1Plateau Atmosphere and Environment Key Laboratory of Sichuan Province, College of Atmospheric Sciences, Chengdu University of Information Technology, Chengdu , Sichuan 610225, China2Chengdu Meteorological Service, Chengdu , Sichuan 611130, Chinashow less
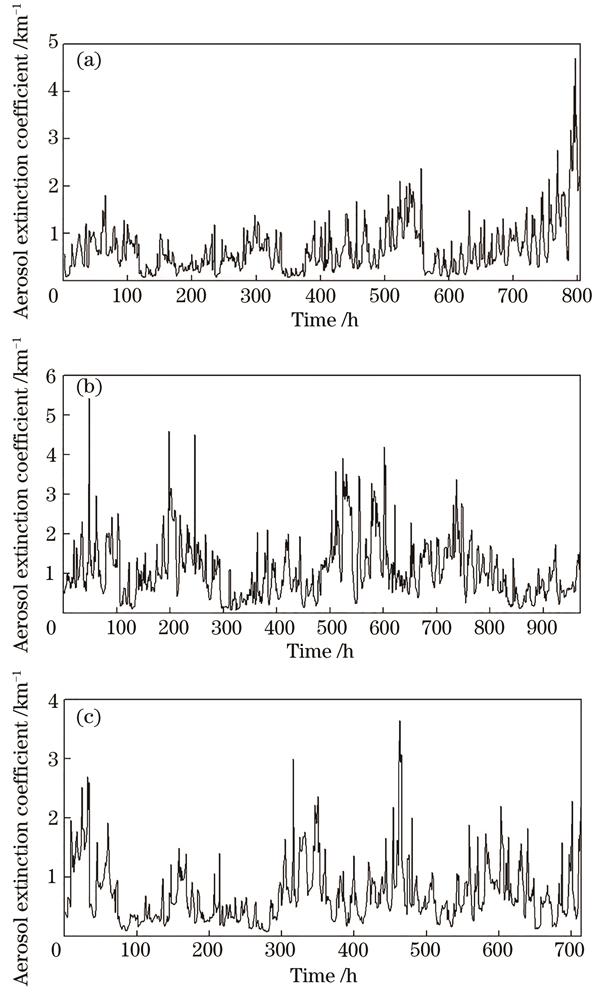
Fig. 1. Time series of the aerosol extinction coefficient. (a) 2015; (b) 2016; (c) 2017
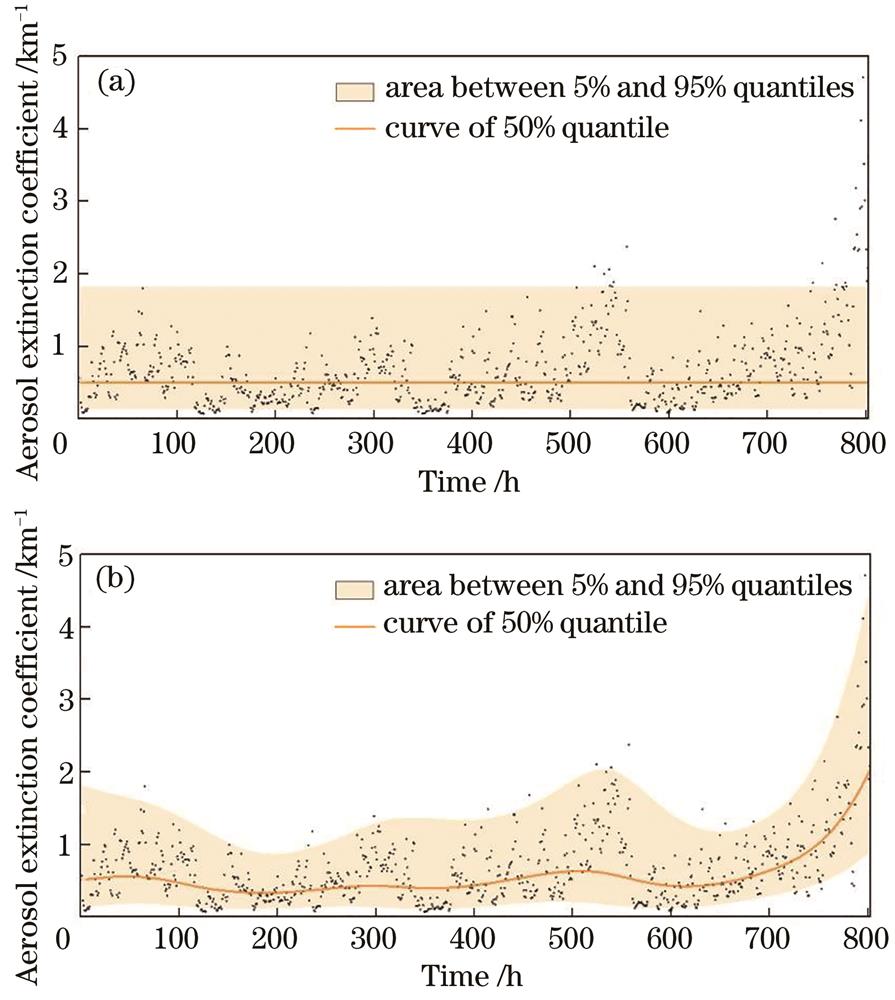
Fig. 2. Centile curves plots based on M0 and M1b_5 models. (a) M0; (b) M1b_5
Fig. 3. AIC value of aerosol extinction coefficient sequence model
Fig. 4. Centile curves plots based M2b model
Fig. 5. QQ plots based on M2b model. (a) 2015; (b) 2016; (c) 2017
Fig. 6. Contribution of each variable in the critical period and the aerosol extinction coefficient
External covariate | Variable | Unit |
---|
Mass concentration | PM2.5 | μg /m3 | Relative humidity | RH | % | Aerosol component structure | | % |
|
Table 1. External covariates
Model code | Variable | Description |
---|
M0 | - | stationary model | M1a | T | linear time model | M1b | T | nonlinear time model | M2a | external covariates | single covariate | M2b | external covariates | multiple covariates,identified by the stepwise selection |
|
Table 2. Parameters of the candidate models
Time | Mean /km-1 | Standard deviation | Skewness coefficient | Kurtosis coefficient | Variation coefficient |
---|
2015 | 0.67 | 0.53 | 2.28 | 9.11 | 0.79 | 2016 | 1.08 | 0.74 | 1.41 | 2.96 | 0.68 | 2017 | 0.71 | 0.51 | 1.69 | 4.01 | 0.72 |
|
Table 3. Statistical parameters of aerosol extinction coefficient time series
Model code | θ1 | θ2 | 2015 | 2016 | 2017 |
---|
M0 | ct | ct | 785.6 | 1880.7 | 704.7 | M1a_1 | T | ct | 722.1 | 1879.7 | 695.4 | M1a_2 | ct | T | 779.5 | 1879.5 | 697.3 | M1a_3 | T | T | 724.0 | 1877.5 | 686.0 | M1b_1 | Xcs(T) | ct | 500.8 | 1597.3 | 533.2 | M1b_2 | Xcs(T) | T | 499.1 | 1783.0 | 535.0 | M1b_3 | ct | Xcs(T) | 703.1 | 1783.1 | 670.8 | M1b_4 | T | Xcs(T) | 643.2 | 1765.3 | 646.3 | M1b_5 | Xcs(T) | Xcs(T) | 462.8 | 1535.9 | 520.6 |
|
Table 4. AIC values of M0 and M1 models
Time | θ1 | θ2 | AIC |
---|
2015 | PM2.5+RH+PM2.5/PM10 | PM2.5 | -437.6 | 2016 | PM2.5+RH+PM2.5/PM10 | PM2.5+RH | 264.2 | 2017 | PM2.5+RH+PM2.5/PM10 | PM2.5+RH+PM2.5/PM10 | -165.1 |
|
Table 5. Aerosol extinction coefficient sequence based on M2 model
Time | Mean | Variance | Skewness | Kurtosis | PPCC |
---|
2015 | -0.012 | 1.001 | -0.131 | 3.291 | 0.998 | 2016 | -0.011 | 1.001 | -0.426 | 3.346 | 0.992 | 2017 | -0.010 | 1.001 | -0.018 | 3.477 | 0.998 |
|
Table 6. Residual analysis results based on the M2b model
Parameter | PM2.5 | RH | PM2.5/PM10 |
---|
2015 | 0.308 | 0.247 | 0.101 | 2016 | 0.333 | 0.264 | 0.043 | 2017 | 0.390 | 0.230 | 0.033 |
|
Table 7. Average contribution of each variable to the nonstationarity of aerosol extinction coefficient series
Process code | Time | Aerosol extinction coefficient /km-1 |
---|
Min | Max |
---|
Process 1 | 20151103T1400—20151104T0100 | 0.548 | 1.803 | Process 2 | 20161205T1400—20161205T2300 | 0.238 | 3.463 | Process 3 | 20171218T1400—20171219T0000 | 0.332 | 2.281 |
|
Table 8. Key period of explosive growth of aerosol extinction coefficient