• Chinese Optics Letters
  • Vol. 18, Issue 4, 041402 (2020)
Renqi Liu1、2, Chun Peng1, Xiaoyan Liang1、3、*, and Ruxin Li1、3、**
Author Affiliations
  • 1State Key Laboratory of High Field Laser Physics, Shanghai Institute of Optics and Fine Mechanics, Chinese Academy of Sciences, Shanghai 201800, China
  • 2Center of Materials Science and Optoelectronics Engineering, University of Chinese Academy of Sciences, Beijing 100049, China
  • 3School of Physical Science and Technology, ShanghaiTech University, Shanghai 200031, China
  • show less
    DOI: 10.3788/COL202018.041402 Cite this Article Set citation alerts
    Renqi Liu, Chun Peng, Xiaoyan Liang, Ruxin Li. Coherent beam combination far-field measuring method based on amplitude modulation and deep learning[J]. Chinese Optics Letters, 2020, 18(4): 041402 Copy Citation Text show less
    (a) A simple schematic diagram of a two-beam tiled-aperture CBC system and (b) the training procedure of DCNN.
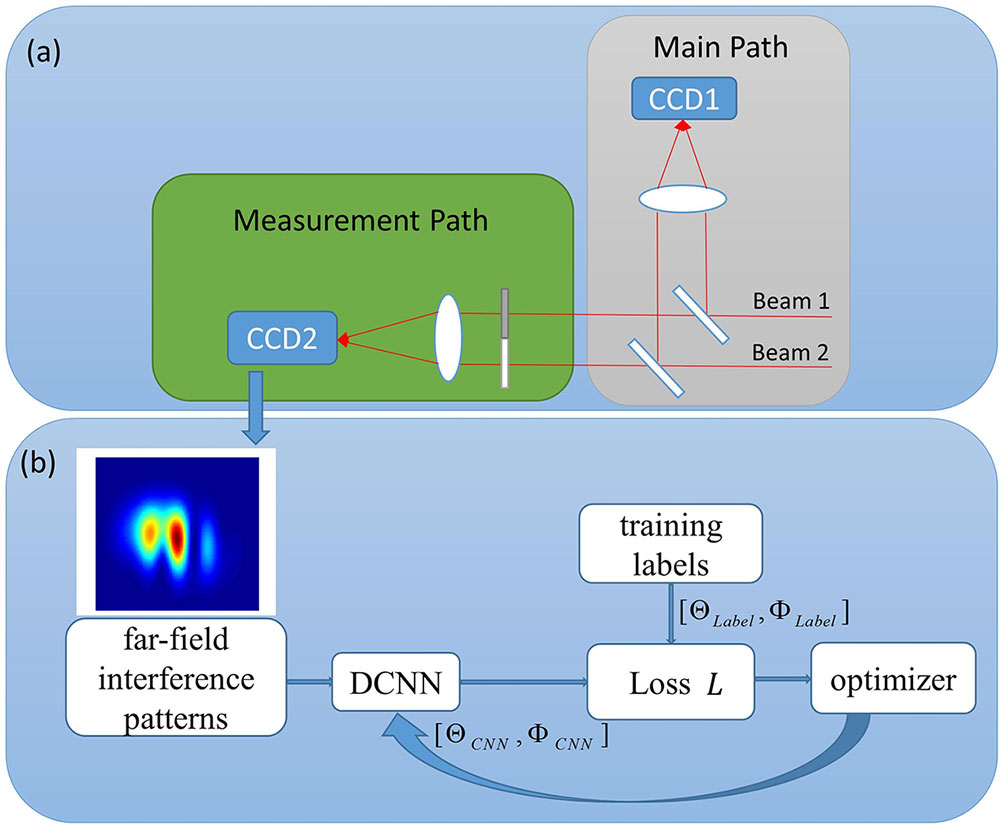
    Fig. 1. (a) A simple schematic diagram of a two-beam tiled-aperture CBC system and (b) the training procedure of DCNN.
    Far-field distribution under different beam-pointing and phase differences: (a) [0,0,0,0,0], (b) [20 μrad,20 μrad,−20 μrad,−20 μrad,0], and (c) [0,0,0,0,π].
    Fig. 2. Far-field distribution under different beam-pointing and phase differences: (a) [0,0,0,0,0], (b) [20μrad,20μrad,20μrad,20μrad,0], and (c) [0,0,0,0,π].
    Far-field distribution under different amplitude modulation ratios: (a) A2=A1, [20 μrad,20 μrad,0,0,0], (b) A2=A1, [0,0,20 μrad,20 μrad,0], (c) A2=2A1, [20 μrad,20 μrad,0,0,0], and (d) A2=2A1, [0,0,20 μrad,20 μrad,0].
    Fig. 3. Far-field distribution under different amplitude modulation ratios: (a) A2=A1, [20μrad,20μrad,0,0,0], (b) A2=A1, [0,0,20μrad,20μrad,0], (c) A2=2A1, [20μrad,20μrad,0,0,0], and (d) A2=2A1, [0,0,20μrad,20μrad,0].
    (a) Training and validation errors across training epochs. (b) The testing set error of 500 samples; the red circle represents the beam-pointing error, and the blue sign represents the phase difference error.
    Fig. 4. (a) Training and validation errors across training epochs. (b) The testing set error of 500 samples; the red circle represents the beam-pointing error, and the blue sign represents the phase difference error.
    Testing set error distribution, in the cases of γ=1, γ=3, γ=10, and γ=30: (a) the beam-pointing error and (b) the phase difference error.
    Fig. 5. Testing set error distribution, in the cases of γ=1, γ=3, γ=10, and γ=30: (a) the beam-pointing error and (b) the phase difference error.
    Testing set error distribution, in the cases of R=1.2, R=1.5, R=2, and R=4: (a) the beam-pointing error and (b) the phase difference error.
    Fig. 6. Testing set error distribution, in the cases of R=1.2, R=1.5, R=2, and R=4: (a) the beam-pointing error and (b) the phase difference error.
    Testing set error distribution, in the cases of D=4 mm, D=10 mm, D=25 mm, and D=50 mm: (a) the beam-pointing error and (b) the phase difference error.
    Fig. 7. Testing set error distribution, in the cases of D=4mm, D=10mm, D=25mm, and D=50mm: (a) the beam-pointing error and (b) the phase difference error.
    Training Set Wavefront Aberration (rad)Testing Set Wavefront Aberration (rad)Beam-pointing Error (μrad)Phase Difference Error (rad)
    000.1930.0243
    π/40.7000.0308
    π/21.5300.0615
    π/400.3460.0484
    π/40.4230.0444
    π/20.9830.0684
    Table 1. Measurement Errors Under Different Wavefront Aberrations
    Renqi Liu, Chun Peng, Xiaoyan Liang, Ruxin Li. Coherent beam combination far-field measuring method based on amplitude modulation and deep learning[J]. Chinese Optics Letters, 2020, 18(4): 041402
    Download Citation