
Sufeng ZHUANG, Yong JI, Dawei TU, Xu ZHANG. Underwater RGB-D Camera Based on Binocular Stereo Vision[J]. Acta Photonica Sinica, 2022, 51(4): 0404003
- Acta Photonica Sinica
- Vol. 51, Issue 4, 0404003 (2022)
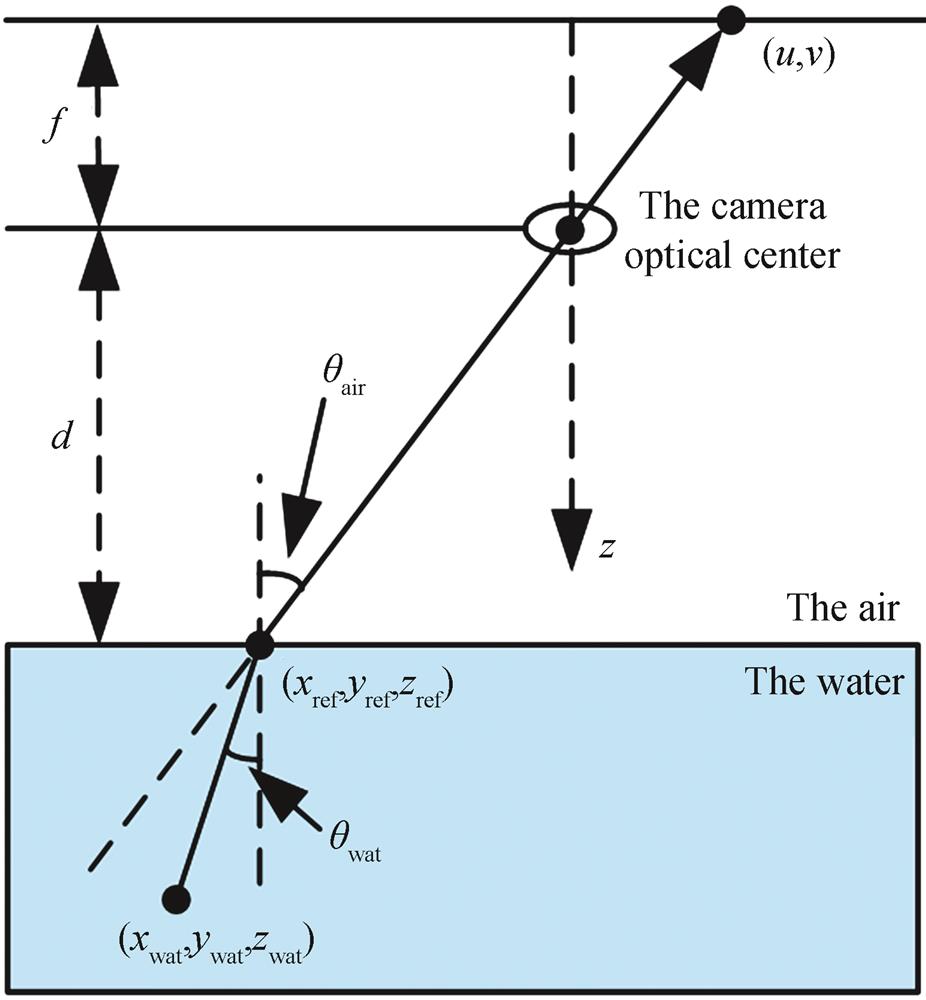
Fig. 1. Underwater camera imaging model
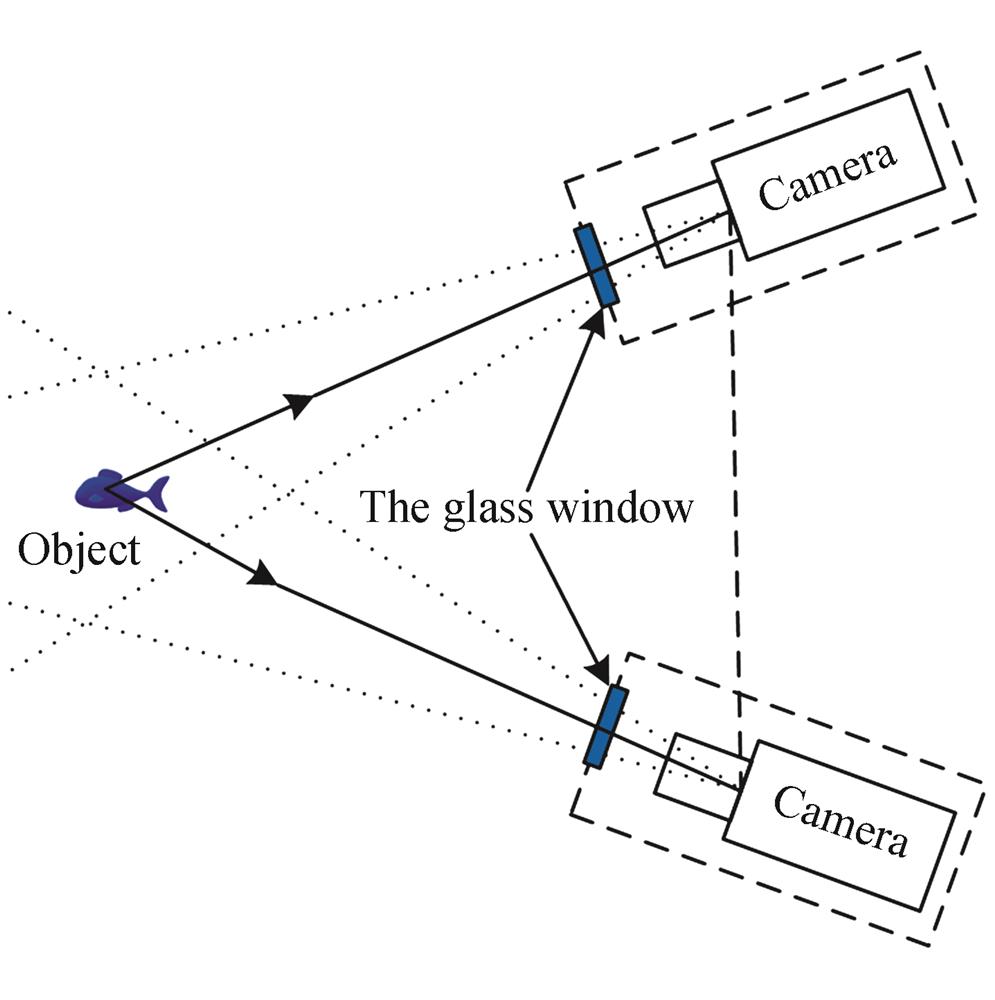
Fig. 2. System Schematic
Fig. 3. Underwater binocular vision model
Fig. 4. Pixel-based matching process diagram
Fig. 5. Flow chart of color correction algorithm
Fig. 6. Enhanced effects of images
Fig. 7. Flow chart of alignment and superposition of 3D point cloud and RGB color
Fig. 8. Alignment superposition model of 3D point cloud and 2D RGB data
Fig. 9. System electrical structure diagram
Fig. 10. Physical engineering prototype
Fig. 11. Internal structure of the central cylinder
Fig. 12. Internal structure of cylinder on both sides
Fig. 13. Experimental scene
Fig. 14. Original underwater images and enhanced images
Fig. 15. Effect comparison of enhancement algorithms
Fig. 16. Registration effect of 3D point cloud and RGB color
Fig. 17. Precision measurement experiment
|
Table 1. the comparison result of different algorithms
| |||||||||||||||||||||||||||
Table 2. Left and right camera calibration parameters
|
Table 3. The measurement data

Set citation alerts for the article
Please enter your email address
© Copyright 2018-2021 | Chinese Laser Press. All Rights Reserved 沪ICP备15018463号-20