
Qiankun Gao, Wenqing Liu, Yujun Zhang, Minguang Gao, Xiangxian Li, Jingjing Tong. Infrared Radiation Passive Remote Detection of Gas in High Temperature Kiln[J]. Acta Optica Sinica, 2017, 37(8): 0801002
- Acta Optica Sinica
- Vol. 37, Issue 8, 0801002 (2017)
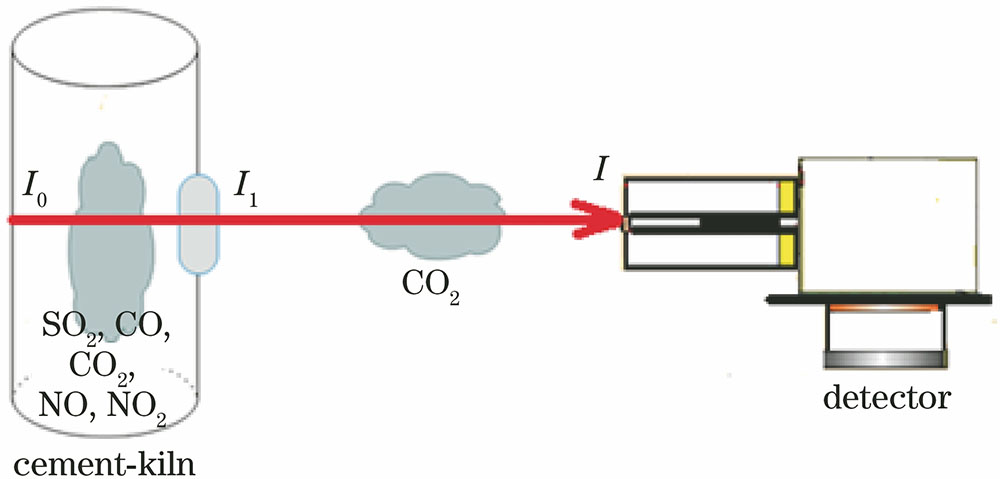
Fig. 1. Radiation model of industrial cement-kiln
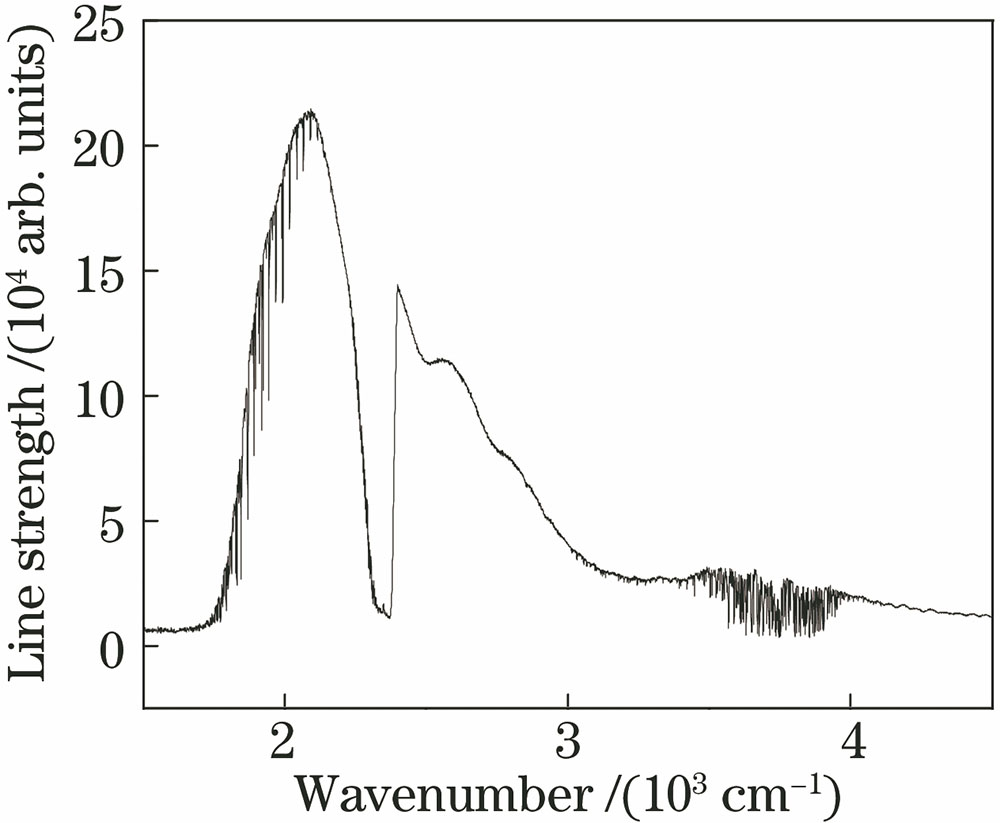
Fig. 2. Averaged spectrum
Fig. 3. Transmittance spectrum of CO2
Fig. 4. Schematic of FTIR system
Fig. 5. Interference signal
Fig. 6. Spectrogram
Fig. 7. Schematic of traditional data processing method
Fig. 8. Averaged results of signal containing turbulence noise in the same group obtained by different data processing methods
Fig. 9. Comparison of spectra ranging from 2100 cm-1 to 2200 cm-1
Fig. 10. Schematic of proposed data processing method
Fig. 11. Absorption spectrum of CO at 1200 ℃
Fig. 12. Corrected and uncorrected transmittance spectra at 2203 cm-1
Fig. 13. Nonlinear least square fitting between calibration spectrum and measurement spectrum of CO
Fig. 14. Residual spectrum after fitting
Fig. 15. CO concentration error under different temperature errors
Fig. 16. Averaged spectrum data of 16 times in industrial site
Fig. 17. On-line monitoring results of gas concentration in cement-kiln
| ||||||||||||||||||||||||||||||||||||||||||||||||||||||
Table 1. CO concentration error with different temperature error

Set citation alerts for the article
Please enter your email address
© Copyright 2018-2021 | Chinese Laser Press. All Rights Reserved 沪ICP备15018463号-20