
Xiaowen Liu, Juncheng Lei, Yanpeng Wu. Synthetic Aperture Radar Target-Recognition Method Based on Bidimensional Empirical Mode Decomposition[J]. Laser & Optoelectronics Progress, 2020, 57(4): 041004
- Laser & Optoelectronics Progress
- Vol. 57, Issue 4, 041004 (2020)
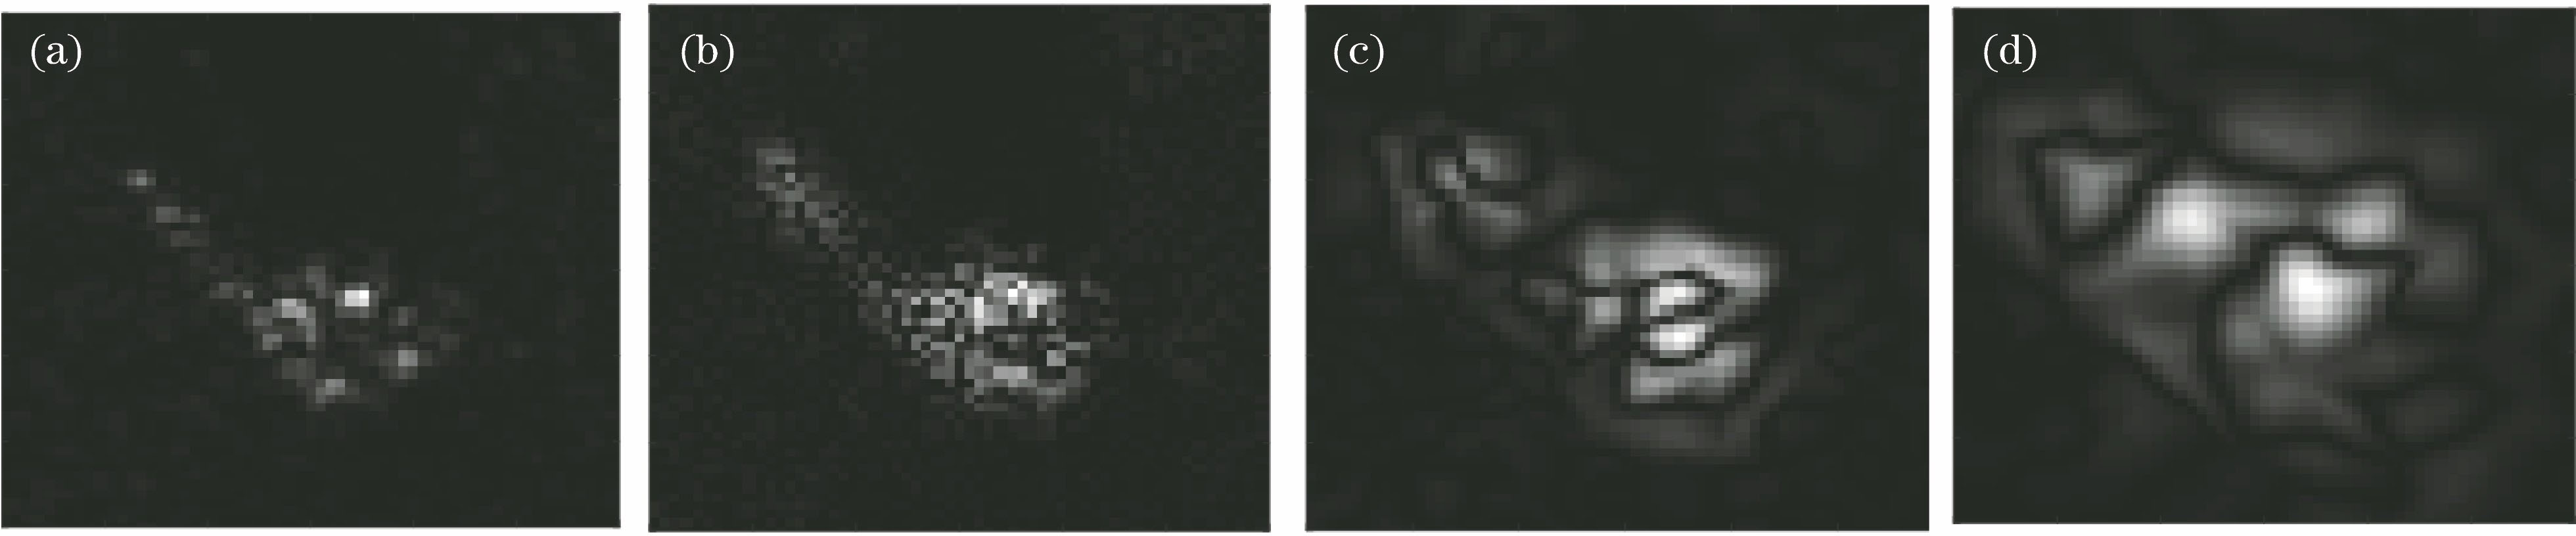
Fig. 1. Illustration of decomposition of SAR images via BEMD. (a) Original image; (b) BIMF at first level; (c) BIMF at second level; (d) BIMF at third level
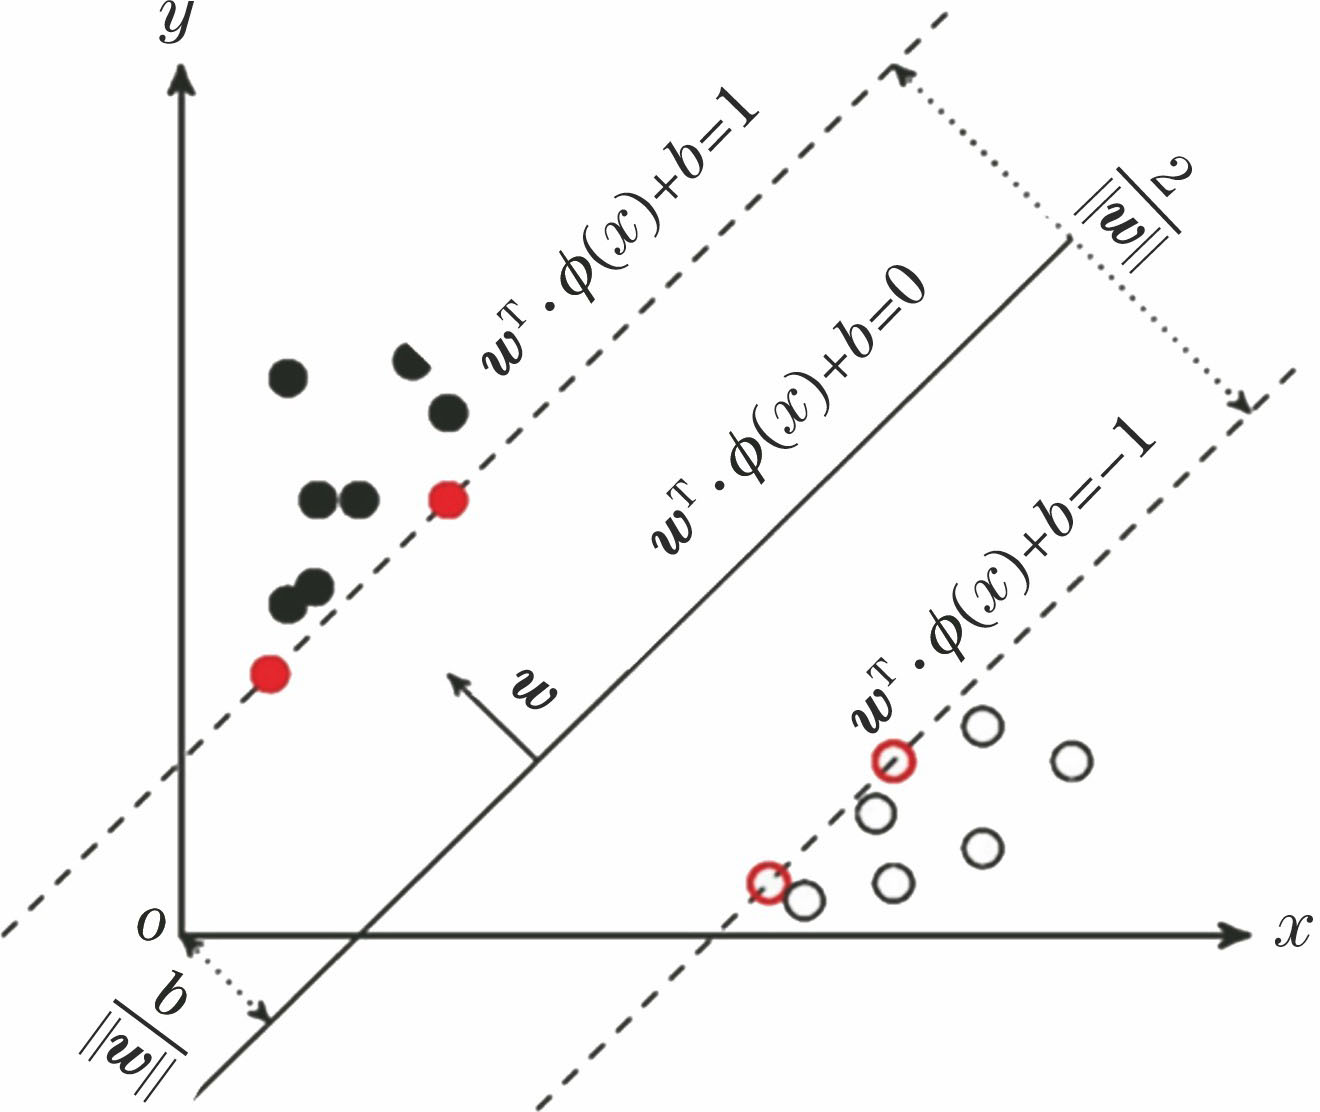
Fig. 2. Illustration of classification principle of SVM
Fig. 3. Basic procedure of SAR target recognition method based on BEMD
Fig. 4. Optical and SAR images of ten targets in MSTAR data set. (a) BMP2; (b) BTR70; (c) T72; (d) T62; (e) BRDM2; (f) BTR60; (g) ZSU23/4; (h) D7; (i) ZIL131; (j) 2S1
Fig. 5. Recognition results of proposed method under standard operating condition
Fig. 6. Recognition performances of proposed and compared methods at different pitch angles
Fig. 7. Recognition performances of proposed and compared methods under noise interference
|
Table 1. Training and test samples under standard operating condition
|
Table 2. Training and test samples with configuration variances
|
Table 3. Training and test samples with pitch angle difference
|
Table 4. Recognition performance of proposed and compared methods under standard opearting condition
|
Table 5. Recognition performance of proposed and compared methods under configuration variances

Set citation alerts for the article
Please enter your email address
© Copyright 2018-2021 | Chinese Laser Press. All Rights Reserved 沪ICP备15018463号-20